Team:KULeuven/Model/Reset
From 2008.igem.org
(→Parameters) |
m |
||
| (17 intermediate revisions not shown) | |||
| Line 1: | Line 1: | ||
| + | {{:Team:KULeuven/Tools/Styling}} | ||
| + | {{:Team:KULeuven/Tools/Scripting}} | ||
{{:Team:KULeuven/Tools/Header}} | {{:Team:KULeuven/Tools/Header}} | ||
| - | + | [[Image:logo_reset.jpg|120px|right]] | |
| + | |||
== Pulse Generator == | == Pulse Generator == | ||
| Line 45: | Line 48: | ||
| 7.0E-4 s<sup>-1</sup> | | 7.0E-4 s<sup>-1</sup> | ||
| | | | ||
| - | | | + | | |
|- | |- | ||
| d<sub>RNA_Lac</sub> | | d<sub>RNA_Lac</sub> | ||
| Line 72: | Line 75: | ||
| 0.00337 | | 0.00337 | ||
| binding cI on cI-Promotor | | binding cI on cI-Promotor | ||
| - | | | + | | |
|- | |- | ||
! colspan="4" style="border-bottom: 1px solid #003E81;" | Transcription rates | ! colspan="4" style="border-bottom: 1px solid #003E81;" | Transcription rates | ||
| Line 96: | Line 99: | ||
| 0.167 s<sup>-1</sup> | | 0.167 s<sup>-1</sup> | ||
| RBS is B0032 (efficiency 0.3) | | RBS is B0032 (efficiency 0.3) | ||
| - | | | + | | |
|- | |- | ||
! colspan="4" style="border-bottom: 1px solid #003E81;" | Hill cooperativity | ! colspan="4" style="border-bottom: 1px solid #003E81;" | Hill cooperativity | ||
| Line 103: | Line 106: | ||
| 2.0 | | 2.0 | ||
| | | | ||
| - | | | + | | |
|} | |} | ||
| + | |||
| + | <br> | ||
| + | |||
| + | All references for parameters can be found below, in the new section. | ||
=== Models === | === Models === | ||
| Line 145: | Line 152: | ||
<body> | <body> | ||
<p> | <p> | ||
| - | <a href="https://static.igem.org/mediawiki/2008/ | + | <a href="https://static.igem.org/mediawiki/2008/e/e7/LactonaseProductionODE.pdf"> |
<img border="0" src="https://2008.igem.org/wiki/skins/common/images/icons/fileicon-pdf.png" width="65" height="60"> | <img border="0" src="https://2008.igem.org/wiki/skins/common/images/icons/fileicon-pdf.png" width="65" height="60"> | ||
</a> | </a> | ||
| Line 163: | Line 170: | ||
! colspan="4" style="border-bottom: 1px solid #003E81;" | Degradation rates | ! colspan="4" style="border-bottom: 1px solid #003E81;" | Degradation rates | ||
|- | |- | ||
| - | | d<sub> | + | | d<sub>aiiA</sub> |
| | d<sub>LVA</sub> = 2.814E-4 s<sup>-1</sup> | | | d<sub>LVA</sub> = 2.814E-4 s<sup>-1</sup> | ||
| LVA-tag reduces lifetime to 40 minutes | | LVA-tag reduces lifetime to 40 minutes | ||
| - | | [ | + | | [https://2008.igem.org/Team:KULeuven/Model/Reset#References [3<html>]</html>] |
|- | |- | ||
| - | | d<sub>closed mRNA | + | | d<sub>closed mRNA aiiA</sub> |
| 0.0046209812 s<sup>-1</sup> | | 0.0046209812 s<sup>-1</sup> | ||
| estimate: because this RNA isn't translated, it degrades faster | | estimate: because this RNA isn't translated, it degrades faster | ||
| - | | [ | + | | [https://2008.igem.org/Team:KULeuven/Model/Reset#References [2<html>]</html>] |
|- | |- | ||
| - | | d<sub>open mRNA | + | | d<sub>open mRNA aiiA</sub> |
| 0.0023104906 s<sup>-1</sup> | | 0.0023104906 s<sup>-1</sup> | ||
| | | | ||
| - | | [ | + | | [https://2008.igem.org/Team:KULeuven/Model/Reset#References [2<html>]</html>] |
|- | |- | ||
| - | | d<sub> | + | | d<sub>mRNA aiiA complex</sub> |
| 0.0023104906 s<sup>-1</sup> | | 0.0023104906 s<sup>-1</sup> | ||
| | | | ||
| - | | [ | + | | [https://2008.igem.org/Team:KULeuven/Model/Reset#References [2<html>]</html>] |
|- | |- | ||
! colspan="4" style="border-bottom: 1px solid #003E81;" | T7 Transcription | ! colspan="4" style="border-bottom: 1px solid #003E81;" | T7 Transcription | ||
| Line 188: | Line 195: | ||
| 421 | | 421 | ||
| dissociation constant, recalculated to remove units | | dissociation constant, recalculated to remove units | ||
| - | | [ | + | | [https://2008.igem.org/Team:KULeuven/Model/Reset#References [4<html>]</html>] |
|- | |- | ||
| k<sub>max</sub> | | k<sub>max</sub> | ||
| 0.044 s<sup>-1</sup> | | 0.044 s<sup>-1</sup> | ||
| maximal T7 transcription rate | | maximal T7 transcription rate | ||
| - | | [ | + | | [https://2008.igem.org/Team:KULeuven/Model/Reset#References [4<html>]</html>] |
|- | |- | ||
! colspan="4" style="border-bottom: 1px solid #003E81;" | Key-Lock constants | ! colspan="4" style="border-bottom: 1px solid #003E81;" | Key-Lock constants | ||
| Line 199: | Line 206: | ||
| K<sub>eq 1</sub> | | K<sub>eq 1</sub> | ||
| 0,015 [M] | | 0,015 [M] | ||
| - | | between closed and open Lactonase mRNA, experimental | + | | between closed and open Lactonase mRNA, modeled for competition, experimental |
| - | | [ | + | | [https://2008.igem.org/Team:KULeuven/Model/Reset#References [1<html>]</html>] |
|- | |- | ||
| K<sub>eq 2</sub> | | K<sub>eq 2</sub> | ||
| 0.0212 [M] | | 0.0212 [M] | ||
| - | | between closed Lactonase mRNA and key unlocked mRNA complex, experimental | + | | between closed Lactonase mRNA and key unlocked mRNA complex, modeled for competition, experimental |
| - | | [ | + | | [https://2008.igem.org/Team:KULeuven/Model/Reset#References [1<html>]</html>] |
|- | |- | ||
| k<sub>dis1</sub> | | k<sub>dis1</sub> | ||
| - | | | + | | 0.00416 s<sup>-1</sup> |
| - | | derived from experimental values | + | | estimate: derived from experimental values |
| - | | [ | + | | [https://2008.igem.org/Team:KULeuven/Model/Reset#References [1<html>]</html>] |
|- | |- | ||
| k<sub>complex1</sub> | | k<sub>complex1</sub> | ||
| - | | | + | | 0.00237 s<sup>-1</sup> |
| - | | derived from experimental values | + | | estimate: derived from experimental values |
| - | | [ | + | | [https://2008.igem.org/Team:KULeuven/Model/Reset#References [1<html>]</html>] |
|- | |- | ||
| k<sub>closed</sub> | | k<sub>closed</sub> | ||
| - | | | + | | 500 s<sup>-1</sup> |
| - | | derived from experimental values | + | | estimate: derived from experimental values |
| - | | [ | + | | [https://2008.igem.org/Team:KULeuven/Model/Reset#References [1<html>]</html>] |
|- | |- | ||
| k<sub>open</sub> | | k<sub>open</sub> | ||
| - | | | + | | 7.5 s<sup>-1</sup> |
| - | | derived from experimental values | + | | estimate: derived from experimental values |
| - | | [ | + | | [https://2008.igem.org/Team:KULeuven/Model/Reset#References [1<html>]</html>] |
|- | |- | ||
| k<sub>translation</sub> | | k<sub>translation</sub> | ||
| 0.167 s<sup>-1</sup> | | 0.167 s<sup>-1</sup> | ||
| lock defined translation rate for Lactonase | | lock defined translation rate for Lactonase | ||
| - | | | + | | [https://2008.igem.org/Team:KULeuven/Model/Reset#References [1<html>]</html>] |
|} | |} | ||
| Line 244: | Line 251: | ||
=== Simulation === | === Simulation === | ||
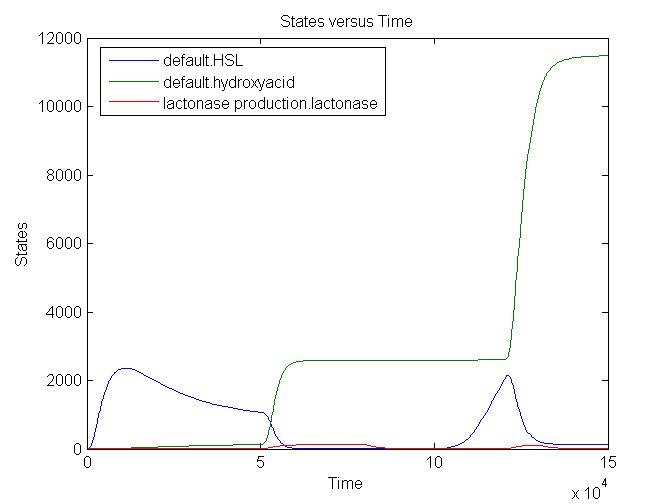
| - | + | During the first 50000 seconds, the input signal TetR (no aTc) is held constant at 5E-5 s<sup>-1</sup>. This results in a background signal of lactonase which will convert a small part of the HSL into hydroxy acid. From 50000 till 80000 seconds, the input signal is at its maximum value: 0.0125 s<sup>-1</sup> (aTc added). This results in an increase of lactonase which converts almost every HSL molecule into the hydroxy acid. The timer is set to 0. After a delay of approximately 20000 seconds, the amount of HSL starts to increase again: the clock is ticking. A shorter pulse of TetR (1000 seconds) only partially resets the timer: not all the HSL is converted into hydroxy acid. The graph has amounts (number of molecules in the cell) plotted vs time, measured in seconds. | |
| - | |||
| - | |||
[[Image:Sim_lactonaseproduction_1.png|700px|center]] | [[Image:Sim_lactonaseproduction_1.png|700px|center]] | ||
| + | |||
| + | === References === | ||
| + | |||
| + | <html xmlns="http://www.w3.org/1999/xhtml" xml:lang="en"> | ||
| + | <head> | ||
| + | <meta http-equiv="Content-Type" content="text/html; charset=utf-8"/> | ||
| + | <title>Bibliography</title> | ||
| + | </head> | ||
| + | <body> | ||
| + | <table style="border-collapse:collapse;line-height:1.1em;"> | ||
| + | <tr style="vertical-align:top;"><td>[1]</td><td style="padding-left:4pt;">“Berkeley2006-RiboregulatorsMain - IGEM”; http://parts2.mit.edu/wiki/index.php/Berkeley2006-RiboregulatorsMain.</td></tr> | ||
| + | <tr><td colspan="2"> </td></tr> | ||
| + | <tr style="vertical-align:top;"><td>[2]</td><td style="padding-left:4pt;">J.A. Bernstein et al., “Global analysis of mRNA decay and abundance in Escherichia coli at single-gene resolution using two-color fluorescent DNA microarrays,” <span style="font-style:italic;">Proceedings of the National Academy of Sciences of the United States of America</span>, vol. 99, Jul. 2002, pp. 9697–9702. <span class="Z3988" title="url_ver=Z39.88-2004&ctx_ver=Z39.88-2004&rft_id=info%3Adoi/10.1073/pnas.112318199&rft_val_fmt=info%3Aofi%2Ffmt%3Akev%3Amtx%3Ajournal&rft.genre=article&rft.atitle=Global%20analysis%20of%20mRNA%20decay%20and%20abundance%20in%20Escherichia%20coli%20at%20single-gene%20resolution%20using%20two-color%20fluorescent%20DNA%20microarrays&rft.jtitle=Proceedings%20of%20the%20National%20Academy%20of%20Sciences%20of%20the%20United%20States%20of%20America&rft.stitle=Proc%20Natl%20Acad%20Sci%20U%20S%20A.%20&rft.volume=99&rft.issue=15&rft.aufirst=Jonathan%20A.&rft.aulast=Bernstein&rft.au=Jonathan%20A.%20Bernstein&rft.au=Arkady%20B.%20Khodursky&rft.au=Pei-Hsun%20Lin&rft.au=Sue%20Lin-Chao&rft.au=Stanley%20N.%20Cohen&rft.date=2002-07-23&rft.pages=9697%E2%80%939702"></span></td></tr> | ||
| + | |||
| + | <tr><td colspan="2"> </td></tr> | ||
| + | <tr style="vertical-align:top;"><td>[3]</td><td style="padding-left:4pt;">J.B. Andersen et al., “New Unstable Variants of Green Fluorescent Protein for Studies of Transient Gene Expression in Bacteria,” <span style="font-style:italic;">Applied and Environmental Microbiology</span>, vol. 64, Jun. 1998, pp. 2240–2246. <span class="Z3988" title="url_ver=Z39.88-2004&ctx_ver=Z39.88-2004&rft_val_fmt=info%3Aofi%2Ffmt%3Akev%3Amtx%3Ajournal&rft.genre=article&rft.atitle=New%20Unstable%20Variants%20of%20Green%20Fluorescent%20Protein%20for%20Studies%20of%20Transient%20Gene%20Expression%20in%20Bacteria&rft.jtitle=Applied%20and%20Environmental%20Microbiology&rft.stitle=Appl%20Environ%20Microbiol.%20&rft.volume=64&rft.issue=6&rft.aufirst=Jens%20Bo&rft.aulast=Andersen&rft.au=Jens%20Bo%20Andersen&rft.au=Claus%20Sternberg&rft.au=Lars%20Kongsbak%20Poulsen&rft.au=Sara%20Petersen%20Bj%C3%B8rn&rft.au=Michael%20Givskov&rft.au=S%C3%B8ren%20Molin&rft.date=1998-06&rft.pages=2240%E2%80%932246"></span></td></tr> | ||
| + | <tr><td colspan="2"> </td></tr> | ||
| + | <tr style="vertical-align:top;"><td>[4]</td><td style="padding-left:4pt;">G.M. Skinner et al., “Promoter Binding, Initiation, and Elongation By Bacteriophage T7 RNA Polymerase: A SINGLE-MOLECULE VIEW OF THE TRANSCRIPTION CYCLE,” <span style="font-style:italic;">J. Biol. Chem.</span>, vol. 279, Jan. 2004, pp. 3239-3244. <span class="Z3988" title="url_ver=Z39.88-2004&ctx_ver=Z39.88-2004&rft_id=info%3Adoi/10.1074/jbc.M310471200&rft_val_fmt=info%3Aofi%2Ffmt%3Akev%3Amtx%3Ajournal&rft.genre=article&rft.atitle=Promoter%20Binding%2C%20Initiation%2C%20and%20Elongation%20By%20Bacteriophage%20T7%20RNA%20Polymerase%3A%20A%20SINGLE-MOLECULE%20VIEW%20OF%20THE%20TRANSCRIPTION%20CYCLE&rft.jtitle=J.%20Biol.%20Chem.&rft.volume=279&rft.issue=5&rft.aufirst=Gary%20M.&rft.aulast=Skinner&rft.au=Gary%20M.%20Skinner&rft.au=Christoph%20G.%20Baumann&rft.au=Diana%20M.%20Quinn&rft.au=Justin%20E.%20Molloy&rft.au=James%20G.%20Hoggett&rft.date=2004&rft.pages=3239-3244"></span></td></tr> | ||
| + | <tr><td colspan="2"> </td></tr> | ||
| + | </table></body> | ||
| + | </html> | ||
Latest revision as of 14:56, 3 October 2008
Contents |
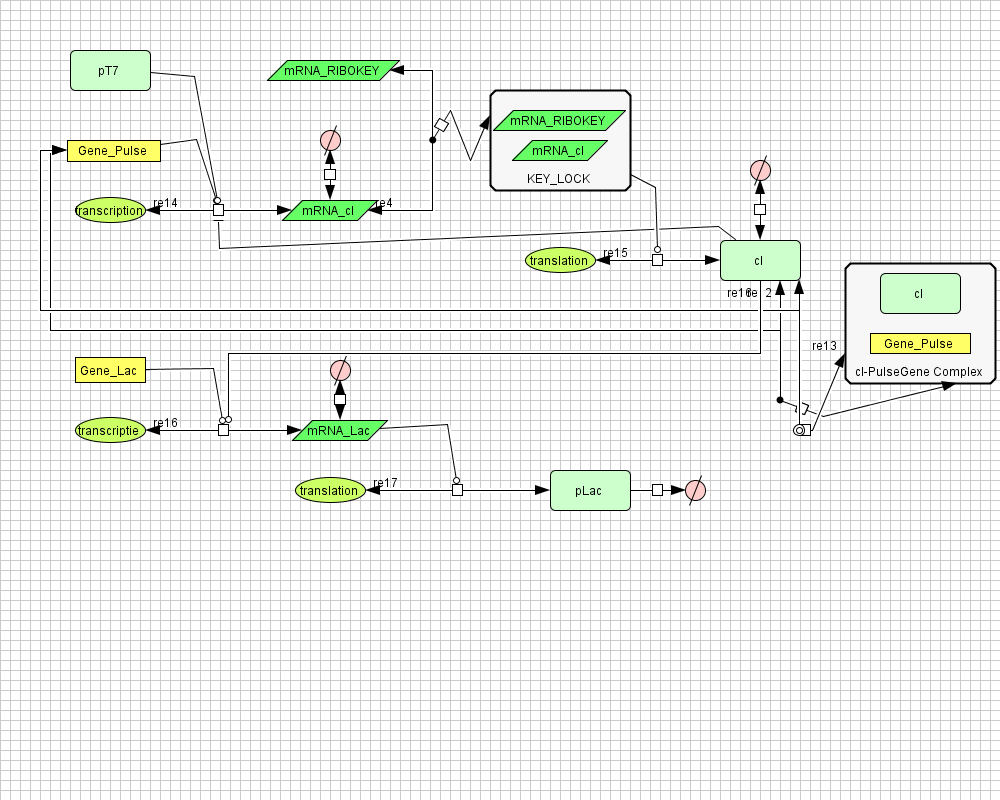
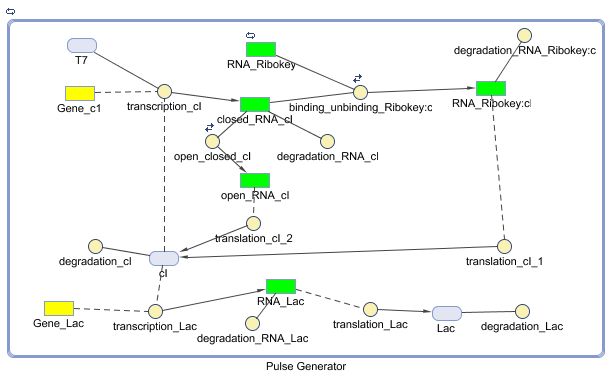
Pulse Generator
Position in the system
The Pulse Generator-subsystem is directly linked to the Filter.
When the filter indicates that the input is zero (there is no desease), the system will (ideally) produce no lactonase. As soon as the output of the filter is one, the subsystem will produce a pulse of lactonase which will be high enough to 'remove' all HSL present in the system and in that way reset the timer.
Describing the system
ODE's
![]() NOT AVAILABLE
NOT AVAILABLE
Parameters
| Name | Value | Comments | Reference |
|---|---|---|---|
| Degradation rates | |||
| dRNA_cI | 0.00462 s-1 | ||
| dcI | 7.0E-4 s-1 | ||
| dRNA_Lac | 0.00231 s-1 | ||
| dLac | 2.888E-4 s-1 | ||
| dRNA_Ribokey:cI | 0.00231 s-1 | ||
| Dissociation constants | |||
| KRibokey:cI | 0.00212 | kass/kdiss for the Ribokey cI complex | |
| KcI | 0.00337 | binding cI on cI-Promotor | |
| Transcription rates | |||
| kRNA_cI | 0.025 s-1 | maximal transcription rate RNA cI (no cI repressor present) | |
| kRNA_Lac | 0.025 s-1 | ||
| Translation rates | |||
| kcI | 0.167 s-1 | ||
| kLac | 0.167 s-1 | RBS is B0032 (efficiency 0.3) | |
| Hill cooperativity | |||
| ncI | 2.0 | ||
All references for parameters can be found below, in the new section.
Models
CellDesigner (SBML file)
Matlab
Problem
The idea of a pulsgenerator as reset mechanism doesn't meet the black-box requirements for the following reasons:
- it takes too long before the proposed system generates a pulse-like event
- the pulse itself is too long
- a constant lactonase production sequence generates enough lactonase to reset the timer
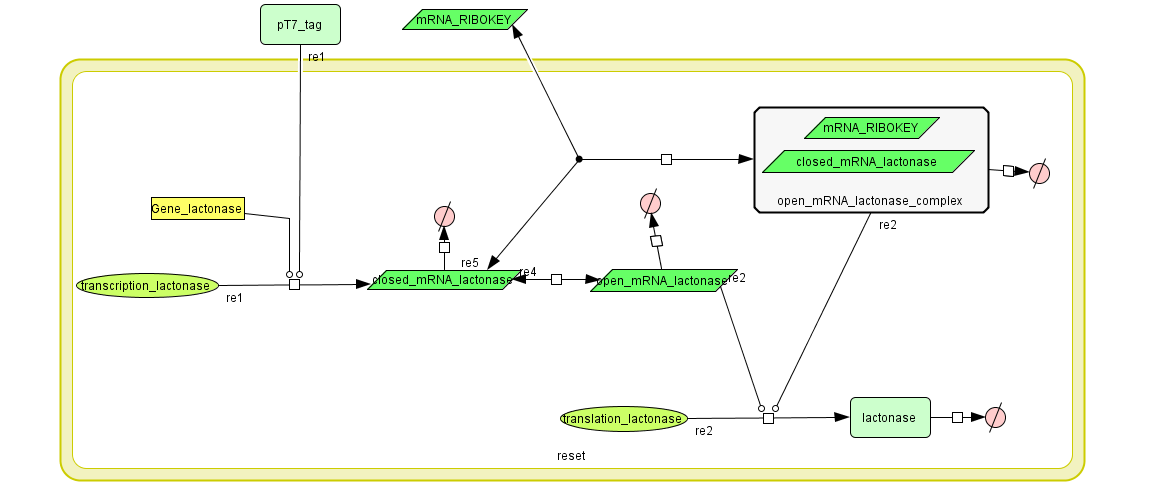
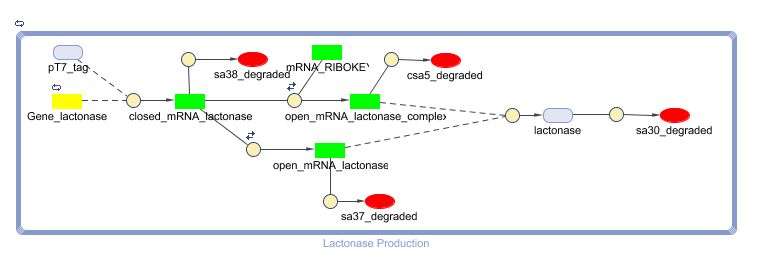
Constant Lactonase Production
Position in the system
The Constant Lactonase Production-system is directly linked to the Filter.
When the filter indicates that the input is zero (there is no desease), the system will (ideally) produce no lactonase. As soon as the output of the filter is one, the system starts producing lactonase and remains doing this untill the light goes off again. In this way all the HSL-molecules that are present will be 'removed' and the timer is reset.
Describing the system
see also: Project:Reset
ODE's
Parameters
| Name | Value | Comments | Reference |
|---|---|---|---|
| Degradation rates | |||
| daiiA | dLVA = 2.814E-4 s-1 | LVA-tag reduces lifetime to 40 minutes | [3] |
| dclosed mRNA aiiA | 0.0046209812 s-1 | estimate: because this RNA isn't translated, it degrades faster | [2] |
| dopen mRNA aiiA | 0.0023104906 s-1 | [2] | |
| dmRNA aiiA complex | 0.0023104906 s-1 | [2] | |
| T7 Transcription | |||
| KT7 | 421 | dissociation constant, recalculated to remove units | [4] |
| kmax | 0.044 s-1 | maximal T7 transcription rate | [4] |
| Key-Lock constants | |||
| Keq 1 | 0,015 [M] | between closed and open Lactonase mRNA, modeled for competition, experimental | [1] |
| Keq 2 | 0.0212 [M] | between closed Lactonase mRNA and key unlocked mRNA complex, modeled for competition, experimental | [1] |
| kdis1 | 0.00416 s-1 | estimate: derived from experimental values | [1] |
| kcomplex1 | 0.00237 s-1 | estimate: derived from experimental values | [1] |
| kclosed | 500 s-1 | estimate: derived from experimental values | [1] |
| kopen | 7.5 s-1 | estimate: derived from experimental values | [1] |
| ktranslation | 0.167 s-1 | lock defined translation rate for Lactonase | [1] |
Models
CellDesigner (SBML file)
Matlab (SBML file)
Simulation
During the first 50000 seconds, the input signal TetR (no aTc) is held constant at 5E-5 s-1. This results in a background signal of lactonase which will convert a small part of the HSL into hydroxy acid. From 50000 till 80000 seconds, the input signal is at its maximum value: 0.0125 s-1 (aTc added). This results in an increase of lactonase which converts almost every HSL molecule into the hydroxy acid. The timer is set to 0. After a delay of approximately 20000 seconds, the amount of HSL starts to increase again: the clock is ticking. A shorter pulse of TetR (1000 seconds) only partially resets the timer: not all the HSL is converted into hydroxy acid. The graph has amounts (number of molecules in the cell) plotted vs time, measured in seconds.
References
| [1] | “Berkeley2006-RiboregulatorsMain - IGEM”; http://parts2.mit.edu/wiki/index.php/Berkeley2006-RiboregulatorsMain. |
| [2] | J.A. Bernstein et al., “Global analysis of mRNA decay and abundance in Escherichia coli at single-gene resolution using two-color fluorescent DNA microarrays,” Proceedings of the National Academy of Sciences of the United States of America, vol. 99, Jul. 2002, pp. 9697–9702. |
| [3] | J.B. Andersen et al., “New Unstable Variants of Green Fluorescent Protein for Studies of Transient Gene Expression in Bacteria,” Applied and Environmental Microbiology, vol. 64, Jun. 1998, pp. 2240–2246. |
| [4] | G.M. Skinner et al., “Promoter Binding, Initiation, and Elongation By Bacteriophage T7 RNA Polymerase: A SINGLE-MOLECULE VIEW OF THE TRANSCRIPTION CYCLE,” J. Biol. Chem., vol. 279, Jan. 2004, pp. 3239-3244. |
 "
"


