|
← Yesterday ↓ Calendar ↑Tomorrow →
Glycerol Stocks
- 1mL of each culture (with 2 clones) has been added to 1mL of 40% glycerol.
- For each clone, two glycerol stocks have been done.
- Stored at -20°C.
| name
| Strain
|
| S141
| MG1655
|
| S142
| J61002
|
Result of the isolation of colonies
E0240 and pSB3K3
E0240 and pSB3K3 are ok : there is a lot of single colonies
Two colonies are picked for an overnight culture at 37°C, 225 rpm, in order to extract plasmids (MiniPreps)
S120 and S121
S120 and S121 : there is a problem, there is nothing on the plates. We have to check whether those strains are really resistant to Amp.
We checked in the strain library, actually the strains do not carry any resistance cassette. We plated them once again on petri dishes with LB without antibiotics
Preparation of the newly ammplified promoters
Electrophoresis of the PCR products made yesterday
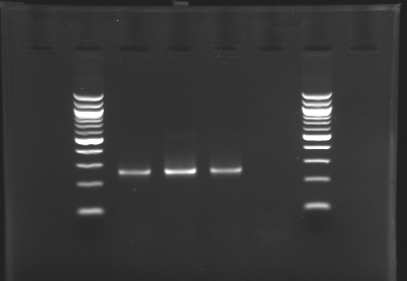 Standart PCR to amplify pflgA, pflgB and pflhB(Gel1) 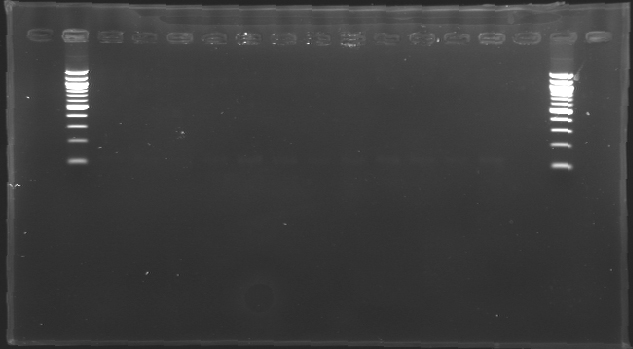 PCR with gradient to amplify pflhDC(Gel2) Electrophoresis settings
- Gel : 1.5 % agar
- 3µL template DNA
- 10µL QuickLoad DNA ladder 100 bp
| Name
| Promotor
| Gel
| Band
| Expected size
| Measured size
|
| PCR_124
| pFlgA
| 1
| 2
| 261 pb
| 250 pb
|
| PCR_125
| pFlgB
| 1
| 3
| 261 pb
| 250 pb
|
| PCR_126
| pFlhB
| 1
| 4
| 260 pb
| 250 pb
|
| PCR_127
| pFlhDC
| 2
| 2 to 13
| 446 pb
| nothing
|
Results
- We have no results for pflhDC, wo don't know yet where is the problem. We will try with other conditions! (yet undetermined)
- Concerning pflhB, pflgA and pflgB, the protocol seems to be very operational: we always have great results !
Washing of the PCR products
- Kit used : Wizard SV Gel and PCR Clean-Up System from Promega
- Standart protocol except the last step. Instead of eluting with water, we used 30 µL of BE buffer (from Qiagen)
DNA concentration measurement
We used two methods:
With a Spectrophotometer
- λ = 260 nm
- White: 100µL BE Buffer
- Templates : 2 µL DNA + 98 µL BE Buffer
| Template
| Absorbance
| Estimated
Concentration
(µg/µL)
|
| pflgA
| 0.202
| 0.5
|
| pflgB
| 0.210
| 0.5
|
| pflhA
| 0.193
| 0.5
|
With a Biophotometer
| Template
| Estimated
Concentration
(µg/µL)
| Ratio DO260/DO280
|
| pflgA
| 0.05
| 1.06
|
| pflgB
| 0.1
| 1.44
|
| pflhA
| 0.O5
| 1.66
|
Remarks :
- There is a great difference between the two methods : sometimes 1 log !
- The electrophoresis of the PCR products showed that pflgB was more concentrated than pflgA and pflhA. As a consequence, we rely on the figures determined by the Biophotometer
Digestion
Protocol
Results
Transformations
Protocol
Use of TOP10 chemically competentcells
- Defroze competent cells on ice during 5'
- Add 5µl of DNA Ligation in 50µL of competent bacterias (or 1µL for the positive control puc19)
- Incubate 30' on ice
- Heat-shock the cells during 30" at 42°C without shaking
- Put 2' on ice
- Add 250µL of pre-warmed SOC medium (4°C)
- Incubate 1h at 37°C under shaking (225rpm)
- Spin at 5.000rpm during 30"
- Remove 150µL of supernatant
- Resuspent the pellet in the 150µL left
- Spread on adequated plates
- Incubate O/N at 37°C
List of the Ligation Transformation
| Name
| Description
| Antibio
|
| Ligation
|
| L128
| J61002-pFlgA
D136 (FV) - D132 (FI)
| Amp
|
| L129
| J61002-pFlgB
D136 (FV) - D133 (FI)
| Amp
|
| L130
| J61002-pFlhB
D136 (FV) - D134 (FI)
| Amp
|
| L131
| J61002-pFlhDC
D136 (FV) - D135 (FI)
| Amp
|
| Control
|
| Control 1
| D136
| Amp
|
| Positive control
| pUC19
| Amp
|
PCR Screening of Ligation Transformants of 1st August
Use of 8 clones of Ligation transformants for screening PCR
Protocol of screening PCR
| Name
| Vol (µl)
| Concentration
|
| Quick Load
| 25µl
| 2X
|
| OligoF_VF2 (O18)
| 1µl
| 10µM
|
| OligoR_VR (O19)
| 1µl
| 10µM
|
| water
| 23µl
|
- 50µl of Mix PCR by tube/clone
- one toothpick of each clone's colony by tube
- Program : Annealing 55°C - Time élongation 1'30" - Number cycle : 29
Conditions of electrophoresis
- 10µl of ladder 1 kb
- 10µl of screening PCR
- migration ~30min at 100W on 1% gel
Results
| PCR1_’’’L101(1-8)’’’
| PCR2_’’’L102(1-8)’’’
| PCR3_’’’L113(1-8)’’’
| PCR4_’’’L114(1-8)’’’
|
| Expected size
| Measured size
| Band
| Expected size
| Measured size
| Band
| Expected size
| Measured size
| Band
| Expected size
| Measured size
| Band
|
|
|
| 2-9
|
|
| 10-17
|
|
| 1, 3-9
|
|
| 10-17
|
|
|
|
| PCR5_’’’L120(1-8)’’’
| PCR6_’’’L122(1-4)’’’
| PCR7_’’’L123(1-8)’’’
| PCR8_’’’L126(1-6)’’’
|
| Expected size
| Measured size
| Band
| Expected size
| Measured size
| Band
| Expected size
| Measured size
| Band
| Expected size
| Measured size
| Band
|
|
|
| 1,2, 4-9
|
|
| 10-13
|
|
| 2-8, 1
|
|
| 3-8
|
|
|
|
| PCR5_’’’L126(7-8)’’’
|
| Expected size
| Measured size
| Band
|
|
|
| 2-3
|
|
|
==> Conclusion :
|
 "
"


