|
← Yesterday ↓ Calendar ↑Tomorrow →
DNA digestion and purification
for each reaction (total volume : 50 µL)
- 20 µL of DNA (MiniPrep product)
- 2 µL of enzyme 1
- 2 µL of enzyme 2
- 5 µL of buffer 2 (10X)
- 0,5 µL of BSA
- 20,5 µL water
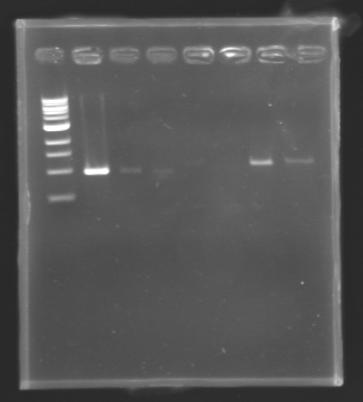
Each reaction was incubated 2 hours at 37°C, then 10 minutes at 60-65°C (to inactivate the enzymes). 10 µL of loading dye (6X) were added to each of the 50 µL of digestion product. The whole samples were run in a 1,5% agarose gel (about 30 minutes at 100 W ; 2 x 30 µL per sample ; 30 µL per well). The bands of interest were then excised from the gel and the DNA was purified using the QIAquick DNA Gel Extraction kit (QIAGEN). Unfortunately, there were not enough columms, so we took some columms from the QIAGEN MiniPrep kit, hoping that it will work with the QIAquick DNA Gel Extraction kit. Some of the samples were too voluminous, so we separated them into two tubes. The elution of DNA was performed using 50 µL of water (after 10 minutes of incubation at 37°C).
Each of the samples was then analysed by a 1,5% agarose gel:
- 2 µL of DNA
- 3 µL of water
- 1 µL of 6X loading dye
The ladder used was the 100 bp ladder from New England Biolabs.
| Name
| BioBrick
| Tube N°
| Enz 1
| Enz 2
| Obs
| Exp Size
| Mea Size
| Conc (ng/µl)
| Gel
| Band
|
| D101
| B0034
| 1
| EcoRI
| XbaI
| FV
| 2076 pb
|
|
|
| 5
|
| D102
| B0034
| 1
| SpeI
| PstI
| BV
| 2077 pb
|
|
|
| 11
|
| D105
| R0079
| 1
| SpeI
| PstI
| BV
| 2222 pb
|
|
|
| 13
|
| D106
| R0040
| 1
| SpeI
| PstI
| BV
| 2119 pb
|
|
|
| 12
|
| D108
| S03154
| 1
| XbaI
| PstI
| BI
| 707 pb
|
|
|
| 14
|
| D111
| S03879
| 1
| XbaI
| PstI
| BI
| 725 pb
|
|
|
| 15
|
| D115
| C0179
| 2
| EcoRI
| SpeI
| FI
| 746 pb
|
|
|
| 4 & 5
|
| D116
| C0179
| 2
| XbaI
| PstI
| BI
| 745 pb
|
|
|
| 2 & 3
|
| D117
| E0030
| 1
| EcoRI
| SpeI
| FI
| 746 pb
|
|
|
| 16
|
| D128
| B0030
| 2
| EcoRI
| XbaI
| FV
| 2079 pb
|
|
|
| 6 & 7
|
| D129
| B0030
| 2
| SpeI
| PstI
| BV
| 2080 pb
|
|
|
| 8 & 9
|
Results :
The amount of DNA loaded was too low and the DNA ladder used was the wrong one. So this experiment has to be reconducted tomorrow.
PCR Screening of the Ligation Transformants
Use of 8 clones of Ligation transformants for screening PCR
Protocol of screening PCR
| Name
| Vol (µl)
| Concentration
|
| Quick Load
| 25µl
| 2X
|
| OligoF_VF2 (O18)
| 1µl
| 10µM
|
| OligoR_VR (O19)
| 1µl
| 10µM
|
| water
| 23µl
|
- 50µl of Mix PCR by tube/clone
- one toothpick of each clone's colony by tube
- Program : Annealing 55°C - Time élongation 1'30" - Number cycle : 29
Conditions of electrophoresis
- 10µl of ladder 1 kb
- 15µl of screening PCR (gel n°1, 2, 3(9-17), 4, 5, 6, 7, 8, 9, 10, 11)
- 10µl of screening PCR (gel n°3(1), 13, 14)
- migration ~30min at 100W on 0,8% gel
Results
| PCR1_’’’L102(1-8)’’’
| PCR2_’’’L103(1-8)’’’
| PCR3_’’’L104(1-8)’’’
| PCR4_’’’L105(1-8)’’’
|
| Expected size
| Measured size
| Band
| Expected size
| Measured size
| Band
| Expected size
| Measured size
| Band
| Expected size
| Measured size
| Band
|
| 1045 pb
| 1000 pb
| 2-->9
| 1003 pb
| 1000 pb
| 10-->17
| 1078 pb
| 1000pb
| 2-->9
| 1239 pb
| 1200 pb
| 10-->17
|
|
|
|
| PCR5_’’’L106(1-8)’’’
| PCR6_’’’L107(1-8)’’’
| PCR7_’’’L108.1(1-8)’’’
| PCR8_’’’L108.2(1-8)’’’
|
| Expected size
| Measured size
| Band
| Expected size
| Measured size
| Band
| Expected size
| Measured size
| Band
| Expected size
| Measured size
| Band
|
| 1200 pb
| 1200 pb
| 2-->9
| 1239 pb
| 1200 pb
| 10-->17
| 1200 pb
| 1200 pb
| 2-->9
| 1200 pb
| 1200 pb
| 10-->17
|
|
|
|
| PCR9_’’’L110(1-8)’’’
| PCR10_’’’L111(1-8)’’’
| PCR11_’’’L112(1-8)’’’
| PCR12_’’’L115(1-7)’’’
|
| Expected size
| Measured size
| Band
| Expected size
| Measured size
| Band
| Expected size
| Measured size
| Band
| Expected size
| Measured size
| Band
|
| 1200 pb
| 1100 pb
| 2-->9
| 1239 pb
| 1100 pb
| 10-->17
| 1200 pb
| 1000 pb
| 2-->10
| 1239 pb
| 700 pb
| 11-->16
|
|
|
|
| PCR13_’’’L115(8)’’’
| PCR14_’’’L116(1-8)’’’
| PCR15_’’’L117(1-6)’’’
|
| Expected size
| Measured size
| Band
| Expected size
| Measured size
| Band
| Expected size
| Measured size
| Band
|
| 1239 pb
| 1200 pb
| 2
| 1200 pb
| 1200 pb
| 3-->10
| 1046 pb
| 1000 pb
| 11-->16
|
|
|
| PCR16_’’’L117(7-8)’’’
| PCR17_’’’L118(1-8)’’’
| PCR18_’’’L119(1-5)’’’
|
| Expected size
| Measured size
| Band
| Expected size
| Measured size
| Band
| Expected size
| Measured size
| Band
|
| 1046 pb
| 1000 pb
| 2-->3
| 1004 pb
| 1100 pb
| 4-->11
| 1079 pb
| 1200 pb
| 12-->16
|
|
|
| PCR19_’’’L119(6-8)’’’
| PCR20_’’’L120(1-8)’’’
| PCR21_’’’L121(1-4)’’’
|
| Expected size
| Measured size
| Band
| Expected size
| Measured size
| Band
| Expected size
| Measured size
| Band
|
| 1079 pb
| 1100 pb
| 2-->4
| 1239 pb
| 1000 pb
| 5-->12
| 1200 pb
| 1200 pb
| 13-->16
|
|
|
| PCR22_’’’L121(5-8)’’’
| PCR23_’’’L122(1-8)’’’
| PCR24_’’’L125(1-4)’’’
|
| Expected size
| Measured size
| Band
| Expected size
| Measured size
| Band
| Expected size
| Measured size
| Band
|
| 1200 pb
| 1000 pb
| 2-->5
| 1239 pb
| 1000 pb
| 6-->12
| 1045 pb
| 1000pb
| 13-->16
|
|
|
| PCR25_’’’L125(5-8)’’’
| PCR26_’’’L109.1(1-7)’’’
| PCR27_’’’L109.2(1-8)’’’
|
| Expected size
| Measured size
| Band
| Expected size
| Measured size
| Band
| Expected size
| Measured size
| Band
|
| 1045 pb
| 1000 pb
| 2-->5
| 1239 pb
| 1100 pb
| 2-->9
| 1239 pb
| 1100 pb
| 10-->17
|
|
|
|
==> Conclusion : with the PCR, we have check that the transformant bacteria contain insert. (obtain amplification at the good size).
But we don't observe results for L102(3), L102(6), L103(4), L106(1), L106(2), L106(4), L111(1)
Migration of an another gel for this sample...
Results:
| PCR1_’’’L102(3;6))’’’
| PCR2_’’’L103(4)’’’
| PCR5_’’’L106(1; 2; 4)’’’
| PCR10_’’’L111(1)’’’
|
| Expected size
| Measured size
| Band
| Expected size
| Measured size
| Band
| Expected size
| Measured size
| Band
| Expected size
| Measured size
| Band
|
| 1045 pb
| 1000 pb
| 2-3
| 1003 pb
| -
| 4
| 1200 pb
| 1100 pb
| 5-6-7
| 1239 pb
| 1100 pb
| 8
|
 Gel 13 : to solve Mistakes |
==> Conclusion : We can observe a results for the samples : L102, L103, L106(4) and L111.
(but not for L106(1; 2))
|
|
 "
"


