|
_Cell Stability, Ca2+ Signaling and DNA-Origami Binding to Cells
Introduction
To test receptor activation in a natural context, it was also tried to
activate T-cells (B12.7.5) with the NIP-linked DNA-origami. Those
T-cells have a NIP Fab-fragment genetically fused to their receptor.
During these tests many problems were faced which could emerge as
obstacles in the main project, the artificial receptor, which is
expressed by 293T-cells.
One problem was to find a medium in which the T-cells survive, the
DNA-Origami structures are stable and which is also suitable for the
fluorescent measurement on the microsope). Normally, the cells were kept
in RPMI (10% FCS), but the phenol red itself is an electron acceptor
and would disturb the measurement. Another complication was, that the
Origami need a high Mg2+ concentration (12.5 mM), which stabilizes the
DNA backbone, but low concentration of other bivalent cations, which
could disrupt the Origami. None of the common cell culture medium does
achieve these conditions. In order to solve the cell culture problem
the stability of the Origami in different media were tested (see
DNA-Origami). On the other hand we also had to test if our cells
survive 12.5 mM Mg2+, which we tested with an MTT-Assay.
As explained before, we also wanted to use the Origami to activate
T-cell receptors (TCR) by clustering. For this experiment we measured
the calcium influx with a FACS, as described earlier (Susana Minguet,
Immunity Vol. 26, Page 43-54). But in this publication much higher
concentration of the stimulus were used than we were able to produce.
Therefore we were looking for another method to measure the calcium
influx. One very commonly used method is to stain the cells with
Fura-2AM and measure the changes in calcium concentration with a
confocal laser scanning microscope. Usually this measurement is only
suitable for adherent cells, because by giving the stimulus to the
cells the cells would move. To avoid this problem we used Poly-L-Lysin
coated µ-Slides(ibidi).
To check, that the DNA-Origami really bind specifically to the
cells(T-cells and B-cells), Alexa 488 linked Origamis with and without
NIP were given to the cells and the fluorescence was visualized with a
LSM.
Material and Methods
Cell stability in the presence of Mg2+ measured by MTT-Assay
To test the Mg2+ tolerance of the T-cells (cell line
B.12.7.5), 100 µl cellsuspension was mixed with 800 µl RPMI
medium and 100 µl MgCl2 or MgAc, respectively
containing various concentrations of Mg2+ in a 24-well plate. 3 days
later cells of each well were spun down, the supernatant was
discarded and the cells were resuspended in 200 µl new RPMI medium. 50
µl 3-(4,5-Dimethylthiazol-2-yl)-2,5-diphenyltetrazoliumbromid (MTT) was
added to each sample. After 4 h of incubation at 37°C the cells were
spun down again and after discarding the medium the pellet was resolved
in 400 µl DMSO and 50 µl Soerensens’ reagent. The reduced blue MTT was
detected in a photometer at 570nm.
B-cells (cell line j558lδmmb1nfleck) from 10 ml dishes were
spun down and resuspended in 9ml Krebs-Ringer-Hepes (12.5mM MgAc).
After incubation for 45 min the cells were spun down again and resolved
in 1 ml PBS. 5 µl of the suspension was mixed with 45 µl Trypan blue and
the cells were counted in a “Neubauer cell chamber”.
293T cells were scraped off an 10 ml dish, spun down and resolved in 10 ml new DMEM medium. 500 µl of this suspension was given in each plate of a 6-well plate containing 4500 µl DMEM medium with different concentrations of Mg2+. 3 days later the media of 3 wells was sucked off and the cells were washed in PBS, then TA-buffer (Tris-Acetat buffer) was given to these wells. After 1h the TA-buffer was removed, the cells of all dishes were washed in PBS and 2ml new DMEM medium plus 500 µl MTT was added. After incubation for 3.5h at 37°C the cells were scraped off the wells and spun down at 13000 rpm for 5min. Then the pellet was resolved in 4 ml DMSO and 500 µl Soerensens’ reagent. Detection took place at 570 nm.
Media
Medium for B- and T-cell :
- RPMI
- 10% FCS
- HEPES (10mM)
- β-mercaptoethanol (50µM)
- L-Glutamine (2 mM)
- 1% Pen-Strep
Medium for 293T:
- DMEM
- 10% FCS
- 5% PenStrep
- L-Glutamine (1.5 mM)
Krebs-Ringer-Hepes (12.5 mM Mg2+):
- NaCl (155 mM)
- KCl (4.5 mM)
- CaCl2 (2 mM)
- MgCl2 (1 mM)
- MgAcetat (11.5 mM)
- D-glucose (10 mM)
- Hepes (5 mM)
-> pH 7.4 with NaOH
Soerensens’ reagent:
- 10 ml glycine (0.1 M)
- 10 ml NaCl (0.1 M)
- 80 ml Aqua dest.
-> pH 10.5 with NaOH
Binding measurement
To test the binding between origamis and T-cells/B-cells 15 µl cell
suspension in Ringer (12.5 mM Mg2+) or TA-buffer (12.5 mM Mg2+) was mixed
with 15 µl of origamis on a µ-Slide (ibidi, µ-Slides 18 well-flat, Cat.
No: 81824). Those slides are coated with Poly-L-Lysine, which fixes the
cells on the bottom of the slide. So the suspensions cells could be
measured on a microscope.
Calcium2+ measurement
Ca2+ measurement with microscope
By binding of ligands to a receptor at the cell surface the cell reacts
amongst others with a efflux of calcium ions from the ER into the
cytoplasm. To measure the intensity of activation one way is to
quantify the concentration or rather the increase of calcium ions in the
cytoplasm. Fura-2 is a fluorescent dye which change the quality
dependent on the Ca2+ concentration. Fura-2AM (Fura-2-acetoxymethyl
ester) is a membrane-permeable derivative of Fura-2 but after crossing
the membrane the acetoxymethyl groups are removed by cellular esterases
so it remains as Fura-2 in the cytoplasm. Fura-2 is excited at 340 nm
and 380 nm of light, and the ratio of the emissions at those
wavelengths is directly correlated to the amount of intracellular
calcium. Without Ca2+ the maximum emission results from excitation at
365nm. With Ca2+ the maximum emission change to excitation at 340 nm and
the emission decrease by extinction at 380 nm.
So to measure properly it is necessary to alternate quickly between the
two excitation wavelengths. Excitation was measured with a high-end
inverted fluorescenc microscope (Zeiss Axiovert 100).
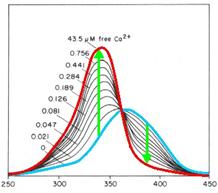
Fig. 1: Fura-2 Emission with (blue) and without free
calciumions (red)
Fura-2 Loading
Procedure:
1. 1 ml T-cell cellsuspension (in Ringer-Solution)
2. + 0.5 µl Pluronic F 127
3. + 0.5 µl Fura-Solution (2mM) and vortex
4. incubation at 37°C and 8% CO2 for 20 min
5. centrifuge at 1000 rpm (206 rcf) and 4°C for 5 min
6. discard the supernatant
7. + 100 µl Ringer-Solution for resuspension
Ca2+ measurement with FACS
Cells resuspended in medium with 1% serum were incubated with 5 μg/ml
of Indo-1, which is the Ca2+ complexing dye, and 0.5 μg/ml of
pluronic F-127, which fasilitates dye uptake (both Molecular Probes) 45
min at 37°C. After incubation, cells were distributed into to 1.5 ml
eppendorf tubes and the washed with the medium we wanted to measure
them. After washing, cells were resuspended in the according medium and
kept on ice. Ca2+ response was induced by addition of the indicated
stimulus 1 min after starting to record the ratio of Ca2+-bound Indo-1
versus unbound Indo-1 with a LSRII fluorescence spectrometer (Becton
Dickinson). Cells were measured for approximately 2min before putting
the stimuli on it. Data were analyzed with the FloJo 6.1 software.
Results and discussion
Cell stability in the presence of Mg2+ measured by MTT-Assay
T-cells:
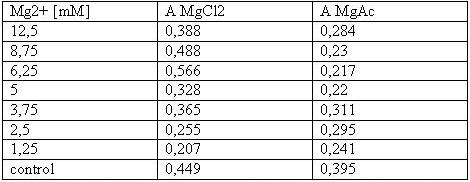
Table 1: Absorbance of reduced MTT of T-cells with various Mg2+ concentration
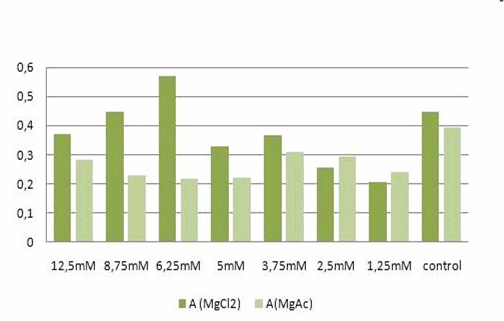
Fig. 2: graphic illustration of the results from Table 1.
B-cells:
Counting stained and unstained B-cells brought following result:
Dead cells : 1
Living cells: 44
Total cell number: 45
293T-cells:
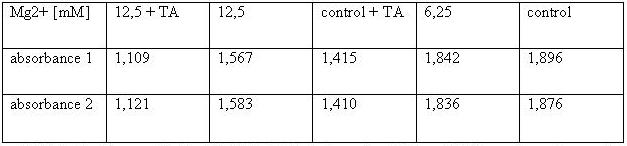
Table 2: Absorbance of reduced MTT of 293T-cells with various Mg2+ concentration and TA treatment
The MTT assays and the trypan blue staining proofed the tolerance of
the used cells towards a concentration up to 12.5 mM Mg2+. This is the
exact concentration in which the origami are produced and stored. The
lower absorbance in the tests with TA could possibly come from the
removal of the TA-buffer because it seemed that the TA buffer disturbs
the adhesion of the 293T cells to the ground of the well so that some
cells might be sucked off with the TA.
Calcium2+ measurement
Ca2+ measurement with FACS
In this measurement we tried to activate T-Cells by clustering.
Therefore we tested two different buffers, Krebs-Ringer-Hepes with
12.5 mM Mg2+ buffer and TA with 12.5 mM Mg2+. As positive control we used
UCHT1 (=anti-CD3), which can stimulate T-cells (Susana Minguet, Vol.
26, Page 43-54).
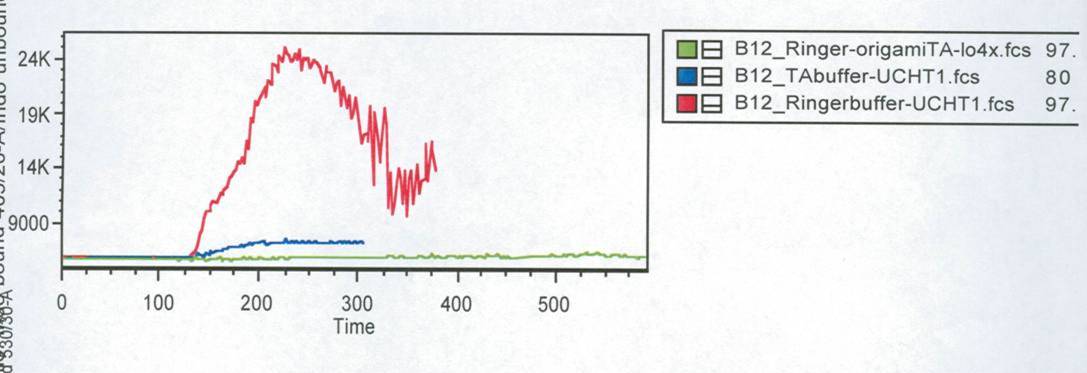
Fig. 3: Results of the FACS measurement. Cells were stained with
Indo-1. Different stimuli were used. Stimuli were given after 1min.
Time is given in seconds.
Green line: cells buffered in
Krebs-Ringer-Hepes buffer. The both other lines show the positive
controls of cells buffered in TA (blue) and Krebs-Ringer-Hepes (red).
Figure 3 shows the change in intra cellular calcium concentration after
adding the DNA-Origami (green) compared to the positive controls (blue
and red). The cells in Krebs-Ringer-Hepes buffer, which were stimulated
with UCHT 1 show a very high activation, while the cells buffered in TA
and the Origami treaded cell show only a slowly signal. When we put the
cells buffered in TA in the LSRII fluorescence spectrometer and
rechecked all the settings we saw, that most of the cells were already
dead. This could be the reason for the low signal of the TA buffered
cells (blue line). The cells treaded with Origami didn´t show any
calcium change at all. After the FACS measurement we tested some of
those Origami on the AFM. None of the Origami which we used were
stable, so probably that is the reason why we couldn´t see any signal
by adding NIP-Origami. To confirm this conclusion this measurement would
have to be carried out again.
Ca2+ measurement with microscope
This measurement was also used to activate the T-cell receptors (TCR)
by clustering. The TCR's were modified with a anti-NIP antibodies and
the NIP-molecules were coupled to DNA origamis. As a negative control
we used a DNA-Origami without NIP. The positive control was Pervanadat.
By adding the origamis to the cells we could see a small signal for
both with and without NIP. The amount of fluorescent cells increase
slowly but there was no significant difference between the negative
control and the sample (7 NIP's per origami).
By contrast the Pervanadat produced a strong signal that differs from
the origami reactions.
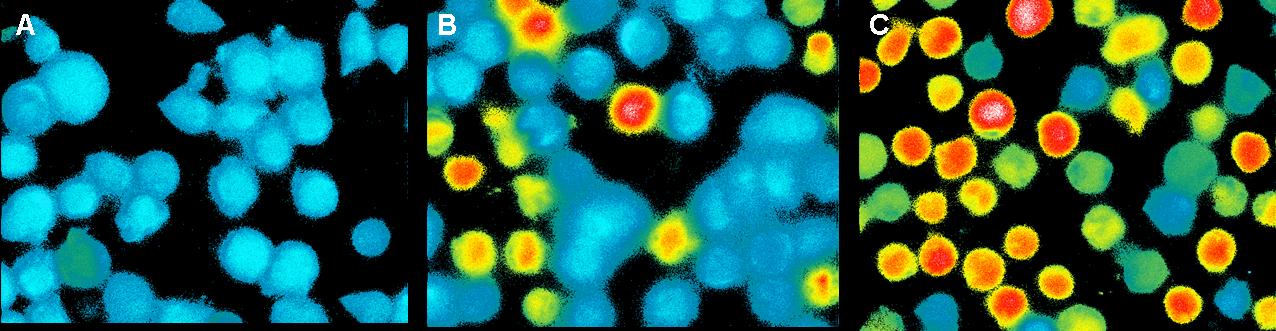
Fig. 4: T-cells stimulated with Pervanadat: A) 1 sec before addition B) 100 sec after addition C) 200 sec after addition
In contrast to the positive control (Pervanadat) which was working quit
well, our sample (DNA-origami with NIP) and the negative control
(DNA-origami without NIP) did not show a significant Ca2+ efflux. There
are two reasons which could be responsible that the cell answer to
origamis with and without NIP’s almost looks the same.
1. Spatial avoidance: Because of the rough surface of T-cells big
molecules could have problems to trigger two or more TCR’s. Also huge
extracellular proteins could avoid that the nanoplates reach the small
TCR’s.
2. Non-specific binding:
Also the negative control produced a weak signal which could result
from non-specific binding to the cell surface, because the cells were
not blocked.
In both cases the slow Ca2+ efflux could result from the mechanical
touch between the cells by adding the liquid with the probes.
Binding measurement
To check, that the DNA-Origami really bind specifically to the T-cells and B-cells, both genetically fused to a NIP Fab-fragment, Alexa 488 linked origamis with and without NIP were given to the cells and the fluorescence was visualized with a LSM. The results are shown in Figure 4 and 5.
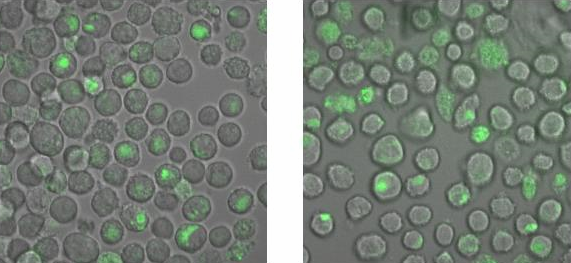
Fig. 5: B-cells with NIP linked Origami (left) and without NIP (right) in 50% TA (Tris-Acetat) and 50% Krebs-Ringer-Hepes buffer,
both buffers contain 12.5 mM Mg2+
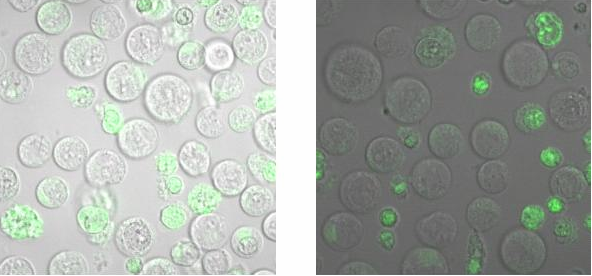
Fig. 6: B-cells with NIP linked Origami (left) and without NIP (right) in TA (Tris-Acetat)
Figure 5 and 6 show that the Origami with NIP as well as the Origami without NIP bound to both cell types. During the binding measurements it seemed that the origamis were
absorbed by the cells or that they bind unspecifically. Later tests at
the AFM, with the same Origami showed no functional origami which could be an explanation to
the behaviour of the cells. The expanded form of the B-cells in
TA-buffer showed that sole TA-buffer is osmotically disadvantageous for
the cells.
|  "
"


