Team:UC Berkeley/LysisDevice
From 2008.igem.org
Introduction
The lysis device allows for the easy release of any product produced in the cell. By using an internal lysis system that can be activated by a variety of external conditions, we hope to allow for the complete automation of product purification.
Device
Our lysis devices are based on phage lysis systems. In both the lambda and T4 phage systems that we used, a holin protein causes "pores" in the inner membrane of E. coli, which allows lysozyme to access and break down the peptidoglycan in the periplasm, causing lysis. An antiholin molecule inhibits the activity of holin, and is used in the natural systems to control the timing of lysis.

In our device, the production of lysozyme and holin is activated by an inducible promoter, while antiholin is constituitively produced. Our lysis device is tunable using these two promoters - we have produced several variations, in particular, devices using Pbad for arabinose-induced lysis, and a device using a promoter that turns on in response to an absence of magnesium.

Characterization and Data
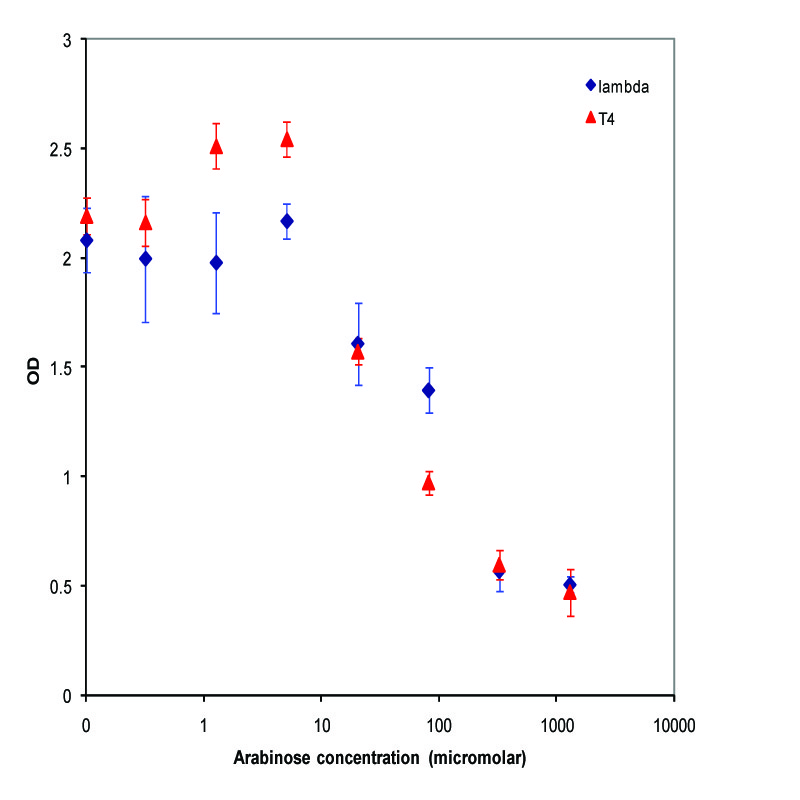
We chose to characterize two of our lysis devices which both use Pbad as the inducible promoter - K112019, a device using lambda phage holin and lysozyme, and K112803, a device using T4 phage holin and lysozyme. After confirming that the devices did indeed work, we took the miniprepped plasmid, transformed into the MC1061 strain, and then picked 5 colonies for each device. We grew these cultures to saturation at 37 degrees Celsius in LB media, and then split into eight 1 mL aliquots. A range of concentrations of arabinose was added to these aliquots, with a starting concentration of 1.3E-3 M and the next 6 samples recieving a four-fold dilution of the previous sample, and an equal volume of water added to the last aliquot. The cultures were then incubated at 37 degrees again for 3.5 hours, and the absorbance at 600nm was measured with a Tecan Xfluor4 Safire2 in a Corning Inc. Costar 3603 plate. The data plotted on a log scale is shown below.
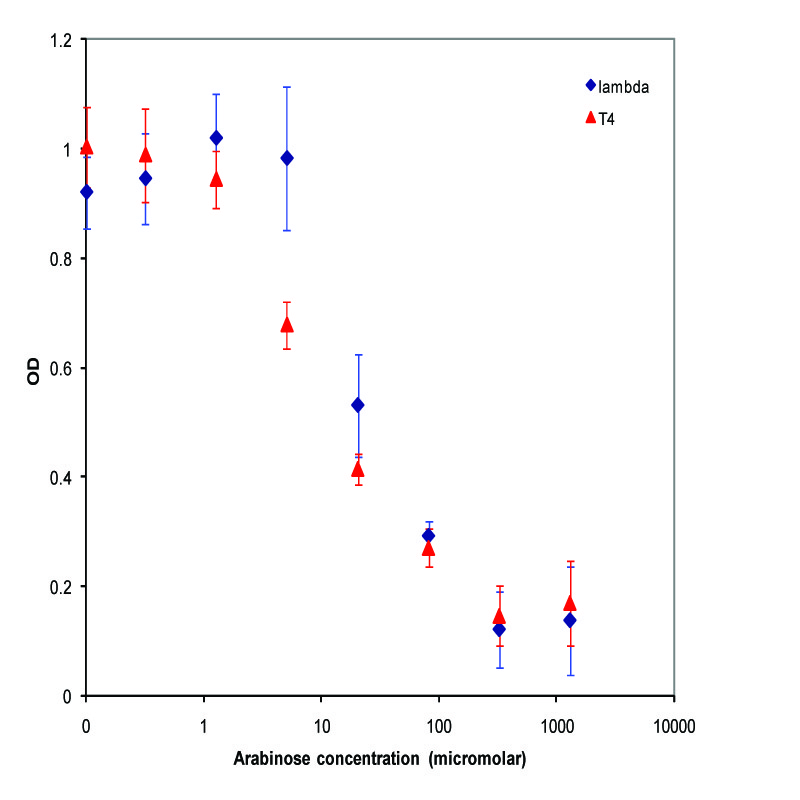
A parallel experiment was performed by taking the same saturated culture before induction with arabinose, diluting 100-fold, growing to mid-log(starting OD .22), before inducing with arabinose as above. The data plotted on a log scale is shown below.
 "
"


