Team:KULeuven/Model/Diffusion
From 2008.igem.org
(→Petri dish) |
m |
||
| (3 intermediate revisions not shown) | |||
| Line 1: | Line 1: | ||
| + | {{:Team:KULeuven/Tools/Styling}} | ||
| + | {{:Team:KULeuven/Tools/Scripting}} | ||
{{:Team:KULeuven/Tools/Header}} | {{:Team:KULeuven/Tools/Header}} | ||
| Line 71: | Line 73: | ||
| Dilution rate in the microchemostat, can be adjusted of course | | Dilution rate in the microchemostat, can be adjusted of course | ||
| [http://www.nature.com/uidfinder/10.1038/msb.2008.24 link] | | [http://www.nature.com/uidfinder/10.1038/msb.2008.24 link] | ||
| + | |- | ||
| + | | N | ||
| + | | 1000 | ||
| + | | number of living cells in the chemostat, included in the full model by using V<sub>ext</sub>/1000 = 1.0E-12 L | ||
| + | | | ||
|} | |} | ||
Latest revision as of 14:58, 3 October 2008
Contents |
Diffusion
The LuxI protein, output of our InverTimer, produces the long-lived 3OC6HSL molecules. These are in fact signaling molecules used by cells to communicate with each other by diffusing in the environment.
Even though HSL in our system is not really aimed at communication between cells, we still need to model diffusion in our system (we expect it to have a nice synchronising effect though). Most importantly because it significantly influences the intracellular HSL concentration, modifying the timer function we're aiming for in our system.
Petri dish
When testing Dr. Coli in a petri dish, one needs to take in to account that the HSL diffuses in the agar. This forms a constant degradation of the extracellular HSL concentration. Diffusion can be numerically modeled using Fick’s law in Matlab.
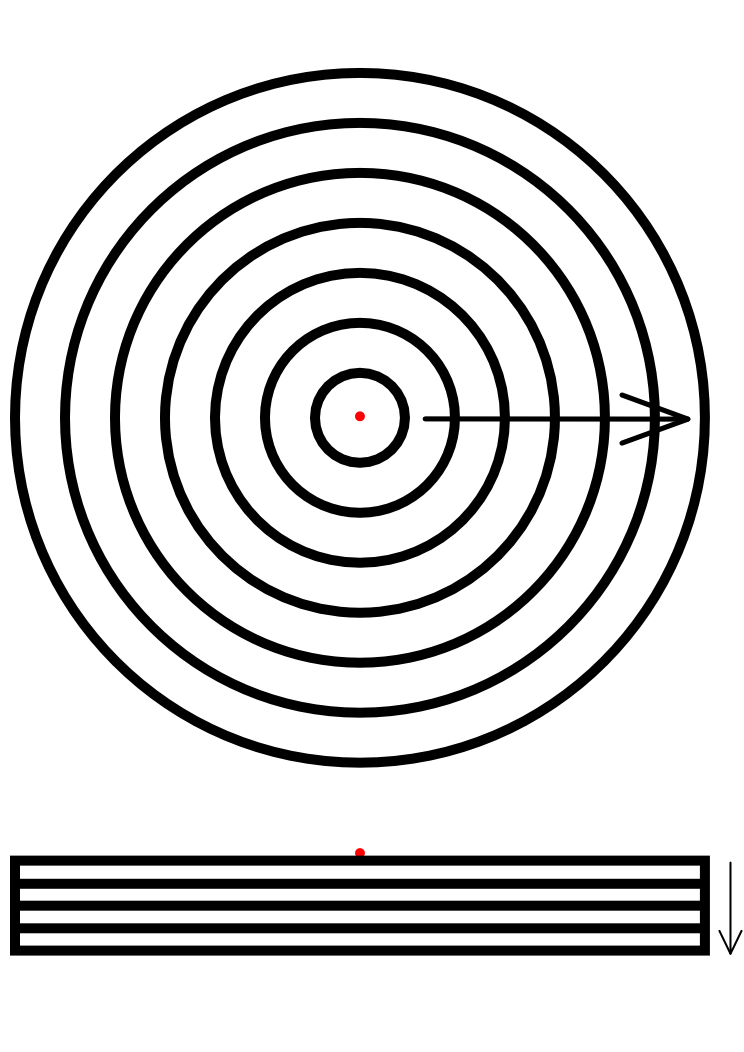
The model can be simplified by assuming there is only one colony in the center of the petri dish. Using cylindrical coordinates instead of Cartesian coordinates only two dimensions remain: radius and depth. The system can than be divided as seen below.
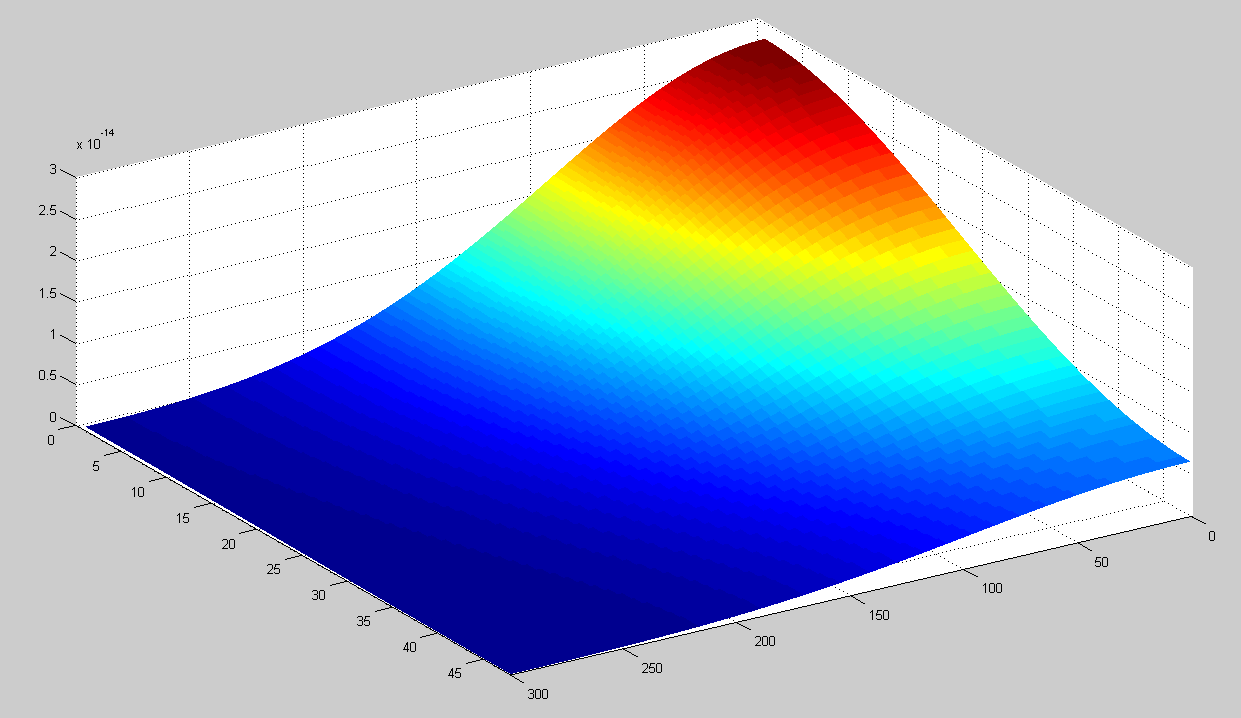
This model can be used to simulate the HSL concentration in the agar when there is one colony of 1000 cells in the center of the dish. To test this, we assume that at t=0 every cell contains 400 HSL molecules. Running this simulation the concentration in the petri dish after one day are shown below. The x-axis shows the radius in 10 micrometers. The depth is indicated in the y-axis in 40 micrometers.
The concentration profile during the simulation can be seen in the movie below.
This model can now be run simultaneous with the Simbiology simulation by continuously updating the extracellular concentration, using Simbiology ‘rules’. An important disadvantage of this approach is that the time step in Matlab has to stay below 5 sec (this can be done in Simbiology with ‘MaxStep’), blowing up the simulation time.
Eventual we chose not to use this simulation. The simulation would take too long. Also the petri dish environment is not representative for the actual use of Dr. Coli.
Microchemostat
Since the final destination of Dr. Coli would be the colon of a patient, we would like to model diffusion in a similar environment. We also want to model a dividing 'colony' of cells (see Multicell) so we can not make the system too large or complex. A compromise between these two has been found in the form of a microchemostat. The use of this device has a couple of very interesting advantages for us.
- The first advantage is that in this device, we can have a continuous flow of new nutrients while old medium is removed, this can create an equilibrium state where the dilution rate is equal to the growth rate of the bacteria. This is a lot more similar to the situation in the gut of a patient than say, a petri-dish.
- Another advantage is the fact that the medium inside the chemostat can be considered to be quite homogeneous, making the precise working out of Fick's laws unnecessary. We still looked at this though, for example in a petri-dish. Output can be seen below.
- The microchemostat contains a relatively small number of cells, placing multi-cell modeling of the system within our grasp.
Parameters
| Name | Value | Comments | Reference |
|---|---|---|---|
| Vcell | 7.0E-16 L | Cellular volume | |
| Vext | 1.0E-12 L | Volume of the microchemostat, 1000 µm3 | |
| σ.A | 2.1E-17 L.s-1 | Permeability of the entire E. coli cell wall | [http://www.pnas.org/content/101/30/10955.full link] |
| Ddilution | 8.0E-5 s-1 | Dilution rate in the microchemostat, can be adjusted of course | [http://www.nature.com/uidfinder/10.1038/msb.2008.24 link] |
| N | 1000 | number of living cells in the chemostat, included in the full model by using Vext/1000 = 1.0E-12 L |
 "
"


