Team:Freiburg Calcium Imaging
From 2008.igem.org
WeberSimone (Talk | contribs) |
WeberSimone (Talk | contribs) |
||
| Line 153: | Line 153: | ||
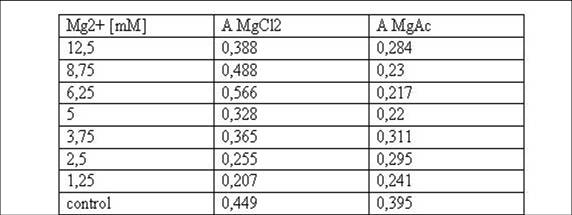
<small>Table 1: Absorbance of reduced MTT of T-cells with various Mg2+ concentration</small><br> | <small>Table 1: Absorbance of reduced MTT of T-cells with various Mg2+ concentration</small><br> | ||
<br> | <br> | ||
| - | [[Image:TeamFreiburg2008-t- | + | [[Image:TeamFreiburg2008-t-cellstability2.PNG]]<br> |
<small>Fig. 2: graphic illustration of the results from Table 1.</small><br> | <small>Fig. 2: graphic illustration of the results from Table 1.</small><br> | ||
<br> | <br> | ||
Revision as of 15:00, 29 October 2008
|
_Cell Stability, Ca2+ Signaling, and DNA-Origami Binding to Cells
IntroductionTo test receptor activation in a natural context, it was also tried to
activate T-cells (B12.7.5) with the NIP-linked DNA-origami. Those
T-cells have a NIP Fab-fragment genetically fused to their receptor.
During these tests many problems were faced which could emerge as
obstacles in the main project, the artificial receptor, which is
expressed by 293T-cells. Material and Methods
Cell stability in the presence of Mg2+ measured by MTT-AssayTo test the Mg2+ tolerance of the T-cells (cell line
B.12.7.5), 100 µl cellsuspension was mixed with 800 µl RPMI
medium and 100 µl MgCl2 or MgAc, respectively
containing various concentrations of Mg2+ in a 24-well plate. 3 days
later cells of each well were spun down, the supernatant was
discarded and the cells were resuspended in 200 µl new RPMI medium. 50
µl 3-(4,5-Dimethylthiazol-2-yl)-2,5-diphenyltetrazoliumbromid (MTT) was
added to each sample. After 4 h of incubation at 37°C the cells were
spun down again and after discarding the medium the pellet was resolved
in 400 µl DMSO and 50 µl Soerensens’ reagent. The reduced blue MTT was
detected in a photometer at 570nm. 293T cells were scraped off an 10ml dish, spun down and resolved in 10ml new DMEM medium. 500µl of this suspension was given in each plate of a 6-well plate containing 4500µl DMEM medium with different concentrations of Mg2+. 3 days later the media of 3 wells was sucked off and the cells were washed in PBS, then TA-buffer was given to these wells. After 1h the TA-buffer was removed, the cells of all dishes were washed in PBS and 2ml new DMEM medium plus 500µl MTT was added. After incubation for 3,5h at 37°C the cells were scraped off the wells and spun down at 13000 rpm for 5min. Then the pellet was resolved in 4ml DMSO and 500µl Soerensens’ reagent. Detection took place at 570nm. Media
Medium for 293T:
Krebs-Ringer-Hepes (12.5mM):
-> pH 7.4 with NaOH Binding measurementTo test the binding between origamis and T-cells/B-cells 15µl cell
suspension in Ringer (12,5mM Mg2+) or TA-buffer (12,5mM Mg2+) was mixed
with 15µl of origamis on a µ-Slide (ibidi, µ-Slides 18 well-flat, Cat.
No: 81824). Those slides are coated with Poly-L-Lysine, which fixes the
cells on the bottom of the slide. So the suspensions cells could be
measured on a microscope. Calcium2+ measurement
Ca2+ measurement with microscopeBy binding of ligands to a receptor at the cell surface the cell reacts
amongst others with a efflux of calciumions from the ER into the
cytoplasm. To measure the intensity of activation one way is to
quantify the concentration or rather the increase of calciumions in the
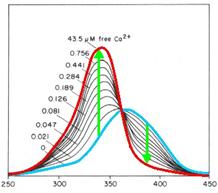
cytoplasm. Fura-2 is a fluorescent dye which change the quality
dependent on the Ca2+ concentration. Fura-2AM (Fura-2-acetoxymethyl
ester) is a membrane-permeable derivative of Fura-2 but after crossing
the membrane the acetoxymethyl groups are removed by cellular esterases
so it remains as Fura-2 in the cytoplasm. Fura-2 is excited at 340 nm
and 380 nm of light, and the ratio of the emissions at those
wavelengths is directly correlated to the amount of intracellular
calcium. Without Ca2+ the maximum emission results from excitation at
365nm. With Ca2+ the maximum emission change to excitation at 340nm and
the emission decrease by extinction at 380nm. Ca2+ measurement with FACSCells resuspended in medium with 1% serum were incubated with 5 μg/ml
of Indo-1, which is the Ca2+ complexing dye, and 0.5 μg/ml of
pluronic F-127, which fasilitates dye uptake (both Molecular Probes) 45
min at 37°C. After incubation, cells were distributed into to 1.5ml
eppendorf tubes and the washed with the medium we wanted to measure
them. After washing, cells were resuspended in the according medium and
kept on ice. Ca2+ response was induced by addition of the indicated
stimulus 1 min after starting to record the ratio of Ca2+-bound Indo-1
versus unbound Indo-1 with a LSRII fluorescence spectrometer (Becton
Dickinson). Cells were measured for approximately 2min before putting
the stimuli on it. Data were analyzed with the FloJo 6.1 software. Results and discussionCell stability in the presence of Mg2+ measured by MTT-AssayT-cells: Calcium2+ measurementCa2+ measurement with FACSIn this measurement we tried to activate T-Cells by clustering.
Therefore we tested two different buffers, Krebs-Ringer-Hepes with
12,5mM Mg2+ buffer and TA with 12,5mM Mg2+. As positive control we used
UCHT1 (=anti-CD3), which can stimulate T-cells (Susana Minguet, Vol.
26, Page 43-54). Ca2+ measurement with microscopeThis measurement was also used to activate the T-cell receptors (TCR)
by clustering. The TCR's were modified with a anti-NIP antibodies and
the NIP-molecules were coupled to DNA origamis. As a negative control
we used a DNA-Origami without NIP. The positive control was Pervanadat. Binding measurementDuring the binding measurements it seemed that the origamis were
absorbed by the cells or that they bind unspecifically. Later tests at
the AFM showed no functional origami which could be an explanation to
the behaviour of the cells. The expanded form of the B-cells in
TA-buffer showed that sole TA-buffer is osmotically disadvantageous for
the cells. |
 "
"


