Team:Minnesota/Project
From 2008.igem.org
(Prototype team page) |
(→Project Details) |
||
| (67 intermediate revisions not shown) | |||
| Line 1: | Line 1: | ||
| - | + | {|align="justify" | |
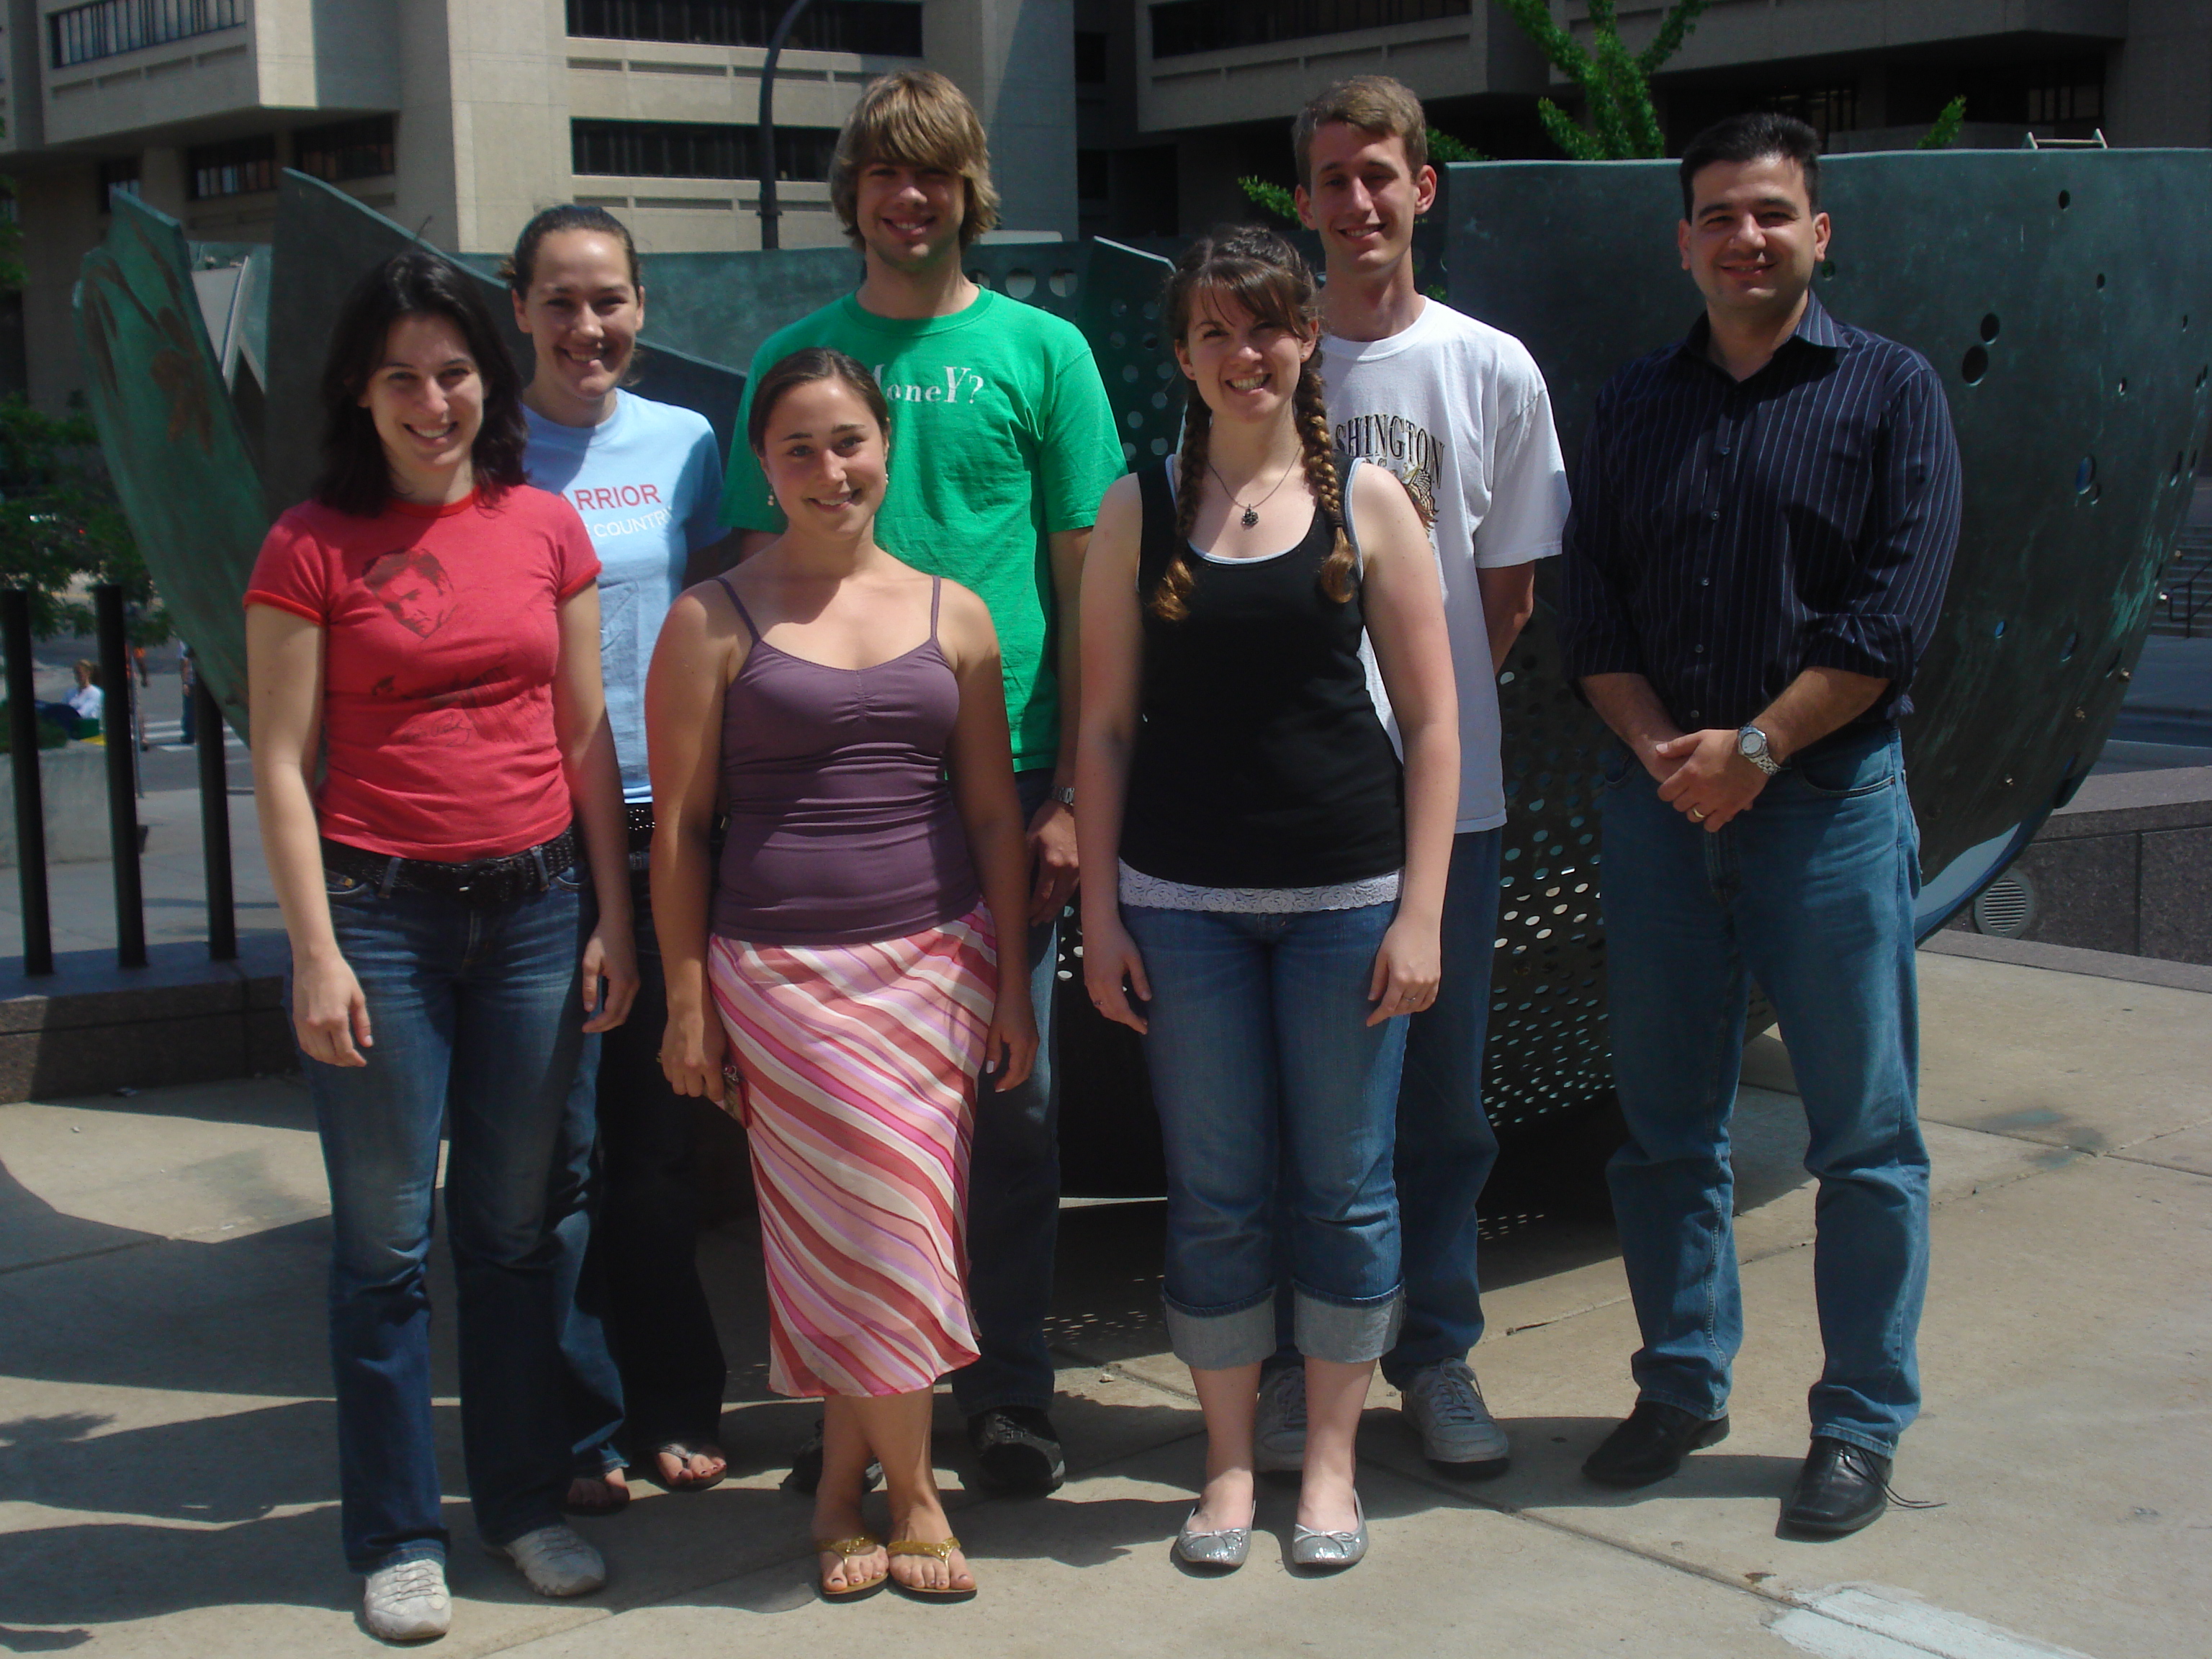
| + | |The Minnesota iGEM '08 team consists of groups working on two different projects. One team is located primarily in Minneapolis and is designing a comparator for their project. The other team is based in St. Paul and is working on a time bomb. | ||
| + | |[[Image:Minnesota.gif|200px|right|frame]] | ||
| + | |- | ||
| + | | | ||
| - | |||
| - | |||
| - | |||
| - | |||
| - | |||
| - | |||
| - | |||
| - | |||
| - | |||
| - | |||
| - | |||
| - | |||
| - | |||
| - | + | '''Team Comparator''' | |
| + | |- | ||
| + | |Control systems are an integral component of almost all aspects of life. Whether it is in industrial, biological, or chemical applications, controllers provide a way to keep systems functioning properly. A vital part of any control system is the comparator. This component compares a set point value and a measured value, and determines which is larger. It then sends the appropriate signal to the controller, which reacts to bring the system back to the set point. In typical applications, the controller equipment is electronic. However, our team set out to create a comparator using only genetic components. This comparator could potentially be used as part of a new, solely biological control system that could be used to treat many diseases afflicting humans, for example diabetes. This comparator could compare the blood sugar of a patient to what it should be, and send this result to a control system that could compensate, for example by changing the levels of insulin. | ||
| + | In order to undertake this task, a system involving six genes was designed. For our system, the two inputs (one representing the set point and one representing the measured value) are IPTG and ATC. These inputs will activate the transcription of the LacI and TetR proteins, and set in motion the rest of the system to produce the outputs. Depending on the amounts of the two inducer molecules added to the system, either green fluorescent protein (GFP) or red fluorescent protein(RFP) will be produced. The actual design of the system can be seen below. In order to complete this project, a total of six genes will have to be cloned into plasmids, and two new BioBrick parts will be produced. One will be a TetR and p22-MNT dual-repressed promoter, and the other will be a LacI and lambdaphage cI dual-repressed promoter. We will also build mathematical models and conduct computer simulations that will help with the designs. This project will pave the way for other parts of a true genetic PID controller to be produced, which could be an exciting scientific development in the near future. | ||
| - | + | ||
| - | + | |[[Image:Team_Pic_Minnesota.jpg|300px|right|thumb|Team Comparator]] | |
| - | |[[Image: | + | |
|- | |- | ||
| | | | ||
| - | |||
| - | |||
| - | |||
| | | | ||
| - | |||
|} | |} | ||
| + | |||
<!--- The Mission, Experiments ---> | <!--- The Mission, Experiments ---> | ||
| Line 41: | Line 31: | ||
!align="center"|[[Team:Minnesota/Notebook|Notebook]] | !align="center"|[[Team:Minnesota/Notebook|Notebook]] | ||
|} | |} | ||
| - | |||
| Line 47: | Line 36: | ||
== '''Overall project''' == | == '''Overall project''' == | ||
| - | + | [[Image:ControlLoopMN.png|thumb|300px|right|Basic Control Loop (Image from [http://www.atp.ruhr-uni-bochum.de/rt1/syscontrol/node5.html]) | |
| + | ]] | ||
| + | Control systems are an integral component of almost all aspects of life. Whether it is in industrial, biological, or chemical applications, controllers provide a way to keep systems functioning properly. A vital part of any control system is the comparator. This component compares a set point value and a measured value, and determines which is larger. It then sends the appropriate signal to the rest of the system. In typical applications, this system is electronic. However, our team set out to create a comparator using only genetic components. This comparator could potentially be used as part of a new, solely biological control system that could be used to treat many diseases afflicting humans, for example diabetes. This comparator could compare a diabetics blood sugar to what it should be, and send this result to a control system that could compensate. | ||
| + | In order to undertake this task, a system involving six genes was designed. For our system, the two inputs (one representing the set point and one representing the measured value) are IPTG and ATC. These inputs will activate the transcription of the LacI and TetR proteins, and set in motion the rest of the system to produce the outputs. Depending on the amounts of the two inducer molecules added to the system, either green fluorescent protein(GFP) or red fluorescent protein(RFP) will be produced. The actual design of the system can be seen below. In order to complete this project, a total of six genes will have to be cloned into plasmids, and two new BioBrick parts will be produced. One will be a TetR and p22 mnt dual-repressed promoter, and the other will be a LacI and lambdaphage cI dual-repressed promoter. This project will pave the way for other parts of a true genetic PID controller to be produced, which could be an exciting scientific development in the near future. | ||
| + | == Project Details== | ||
| + | {| | ||
| + | |In order to design a genetic comparator, the team first looked at an electronic comparator to try to emulate it. A typical comparator has two inputs: A is the set point value, which is input into the system, and B is the measured value, which is found by measuring the controlled variable and sending this result back to the comparator. Once the comparator recieves these two values, it compares them and produces a signal. Typical this signal is positive or negative. However, for a genetic controller, there is no such thing as a negative growth, so the genetic system was forced to have two outputs, instead of the one found on typical systems. These outputs were designated epsilon+ and epsilon- to distinguish whether the signal was positive or negative. A black-box comparator can be seen below. | ||
| + | |- | ||
| + | |[[Image:BasicComparatorMN.jpg|thumb|500px|center|Basic Function of Comparator | ||
| + | ]] | ||
| + | |- | ||
| + | |The goal of our comparator design is to take two inputs and produce an output based on the level of each input. In order for this to be accomplished, we designed the comparator such that Epsilon = A - B, where A and B are the designated inputs. If A is larger, the epsilon+ response is observed, whereas if B is larger, the epsilon- response is observed. In the rare biological case where A and B are equal, no reponse will be seen, indicating that the system is at equilibrium -- the setpoint. In our system, the epsilon+ and epsilon- responses are differentiated by being linked to fluorescent proteins. This will allow us to readily test the effectiveness and accuracy of our comparator. | ||
| + | As shown below, the level of each output response can be qualitatively modeled. Partitioning the level of each input, A and B, into low, medium, and high quantities indicates the corresponding output response. Thus, only when the qualitative measurement of input B is less than that of input A will a large epsilon+ response be observed. The same applies in the case of the epsilon- response. This same idea can be translated into Boolean logic, as indicated below. Based on this logic, only when A is present and B is not, an epsilon+ response will occur. Similarly, only when B is present and A is not, the epsilon- response will be observed. | ||
| + | |- | ||
| + | |<div align="center"><gallery perRow="2" widths="300px" heights="200px"> | ||
| + | Image:epluslogic.jpg|Qualitative Comparison for e+ response | ||
| + | Image:eminuslogic.jpg|Qualitative Comparison for e- response | ||
| + | Image:eplusboolean.jpg|Boolean Logic for e+ response | ||
| + | Image:eminusboolean.jpg|Boolean Logic for e- response | ||
| + | </gallery></div> | ||
| + | |- | ||
| + | | | ||
| - | + | From these Boolean tables, logic statements can be generated that give the response desired. These statements are shown below. | |
| + | |- | ||
| + | |[[Image:AandnotbMN.jpg|thumb|500px|center|Equation for epsilon+ response | ||
| + | ]] | ||
| + | |- | ||
| + | |[[Image:BandnotaMN.jpg|thumb|500px|center|Equation for epsilon- response | ||
| + | ]] | ||
| + | |- | ||
| + | | | ||
| + | Another way to state this logic, which makes it easier to design a system that generates this response, is shown below. | ||
| - | + | |- | |
| + | |[[Image:AnornotbMN.jpg|thumb|500px|center|Equation for Comparator | ||
| + | ]] | ||
| + | |- | ||
| + | |[[Image:BnornotaMN.jpg|thumb|500px|center|Equation for Comparator | ||
| + | ]] | ||
| + | |- | ||
| + | |Even though these logic statements seem straightforward, the actual implementation of this logic in a biological system is actually fairly difficult. For the two inputs to the system, there are four possible states: neither A or B, more A than B, more B than A, and equal A and B. In order for the controller to be robust, it must respond correctly to each of these scenarios. This is accomplished by following the logic from the equations above. In order get the four components of the equations above (A, B, NOT A, NOT B), four genes were needed, one for each of these components. Furthermore, there must be two sets of two genes each that are linked together. NOT A and A must be linked, and NOT B and B must be as well. In order to get the NOT relationship, the gene products of A and B must repress the production of the NOT A and NOT B genes. | ||
| + | |- | ||
| + | |[[Image:BasicFlowChartMN.jpg|thumb|900px|center|Basic Schematic of Project | ||
| + | ]] | ||
| + | |- | ||
| + | |[[Image:ProjectFlowchartMN.jpg|thumb|900px|center|Detailed Schematic of Project | ||
| + | ]] | ||
| + | |} | ||
| + | === Relevant Papers === | ||
| + | {| | ||
| + | | | ||
| + | '''Protocol Papers''' | ||
| + | |- | ||
| + | |[[Media:BacterialcultureMN.pdf|Bacteria Culture Protocols]] | ||
| + | |- | ||
| + | |[[Media:PCRtutorialMN.pdf|PCR Tutorial]] | ||
| + | |- | ||
| + | |[[Media:SubcloningMN.pdf|Subcloning]] | ||
| + | |- | ||
| + | |[[Media:TransformationsMN.pdf|Transformations]] | ||
| + | |- | ||
| + | |[[Media:Western_blottingMN.pdf|Western Blotting 1]] | ||
| + | |- | ||
| + | |[[Media:WesternblotMN.pdf|Western Blotting 2]] | ||
| + | |- | ||
| + | | | ||
| + | '''Basic BioBrick Design''' | ||
| + | |- | ||
| + | |[[Media:Biobricks vector designMN.pdf|BioBrick Vector Design Paper]] | ||
| + | |- | ||
| + | | | ||
| + | '''Combinatorial Promoters Papers''' | ||
| - | + | |- | |
| + | |[[Media:ModularANDgateMN.pdf|Modular AND Gate]] | ||
| + | |- | ||
| + | |[[Media:CisRegulatoryInputMN.pdf|''cis'' Regulatory Input]] | ||
| + | |- | ||
| + | |[[Media:CombinatorialpromotersMN.pdf|Combinatorial Promoters]] | ||
| + | |- | ||
| + | |[[Media:DirectedEvolutionofAraCMN.pdf|Directed Evolution of AraC]] | ||
| + | |- | ||
| + | | | ||
| + | '''p22 mnt Papers''' | ||
| + | |- | ||
| + | |[[Media:Mnt01MN.pdf|DNA binding specificity of the Arc and Mnt repressors]] | ||
| + | |- | ||
| + | |[[Media:Mnt02MN.pdf|Bacteriophage P22 Mnt Repressor]] | ||
| + | |- | ||
| + | |[[Media:P22mntMN.pdf|The Bacteriophage P22 Arc and Mnt Repressors]] | ||
| + | |- | ||
| + | | | ||
| + | '''Light Sensor Papers''' | ||
| + | |- | ||
| + | |[[Media:Chevalier_light_sensorMN.pdf|Chevalier Light Sensor]] | ||
| + | |- | ||
| + | |[[Media:Young_light_sensor_reviewMN.pdf|Young Light Sensor]] | ||
| + | |- | ||
| + | |[[Media:Young_UV_light_sensor_caged_IPTGMN.pdf|Young Light Sensor (caged IPTG)]] | ||
| - | |||
| + | |||
| + | === The Experiments === | ||
== Results == | == Results == | ||
Latest revision as of 15:22, 27 June 2008
| The Minnesota iGEM '08 team consists of groups working on two different projects. One team is located primarily in Minneapolis and is designing a comparator for their project. The other team is based in St. Paul and is working on a time bomb. | |
|
| |
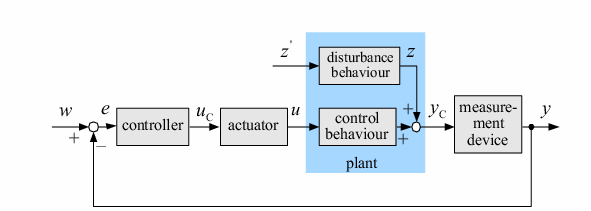
| Control systems are an integral component of almost all aspects of life. Whether it is in industrial, biological, or chemical applications, controllers provide a way to keep systems functioning properly. A vital part of any control system is the comparator. This component compares a set point value and a measured value, and determines which is larger. It then sends the appropriate signal to the controller, which reacts to bring the system back to the set point. In typical applications, the controller equipment is electronic. However, our team set out to create a comparator using only genetic components. This comparator could potentially be used as part of a new, solely biological control system that could be used to treat many diseases afflicting humans, for example diabetes. This comparator could compare the blood sugar of a patient to what it should be, and send this result to a control system that could compensate, for example by changing the levels of insulin.
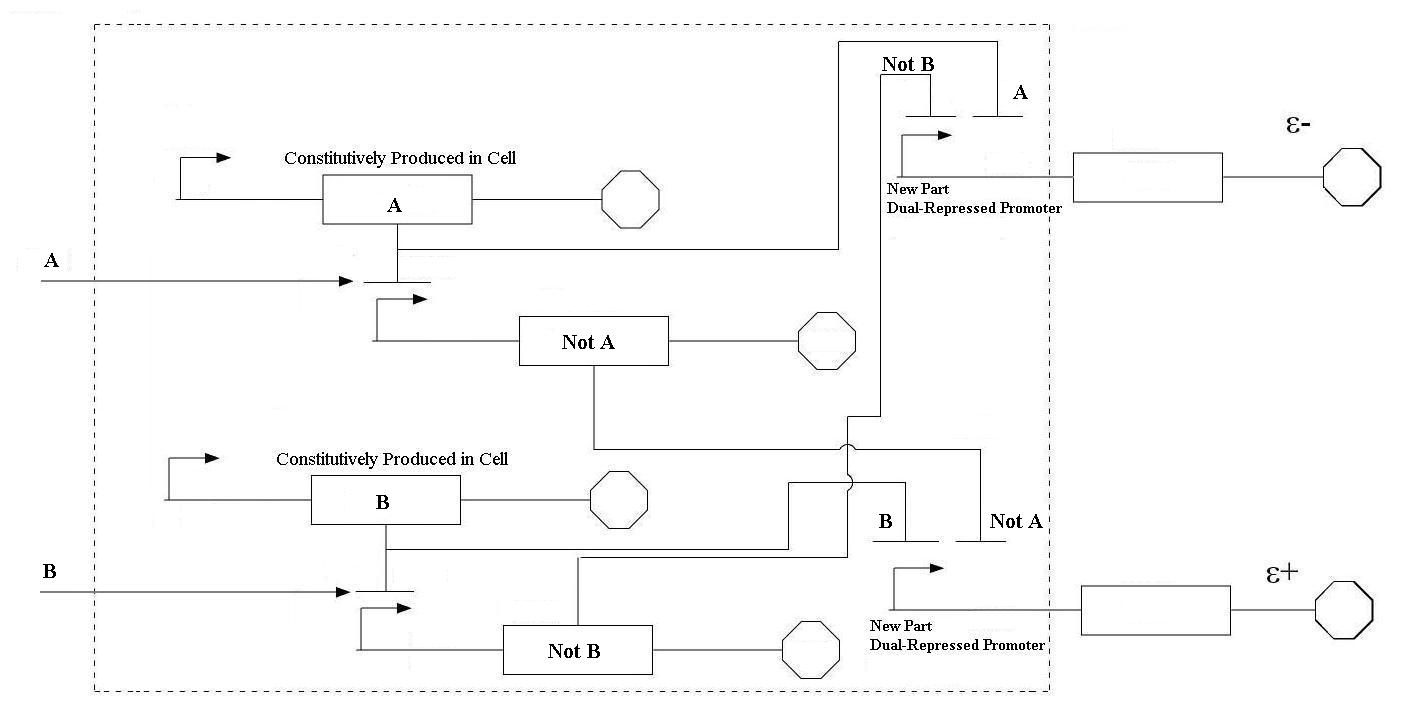
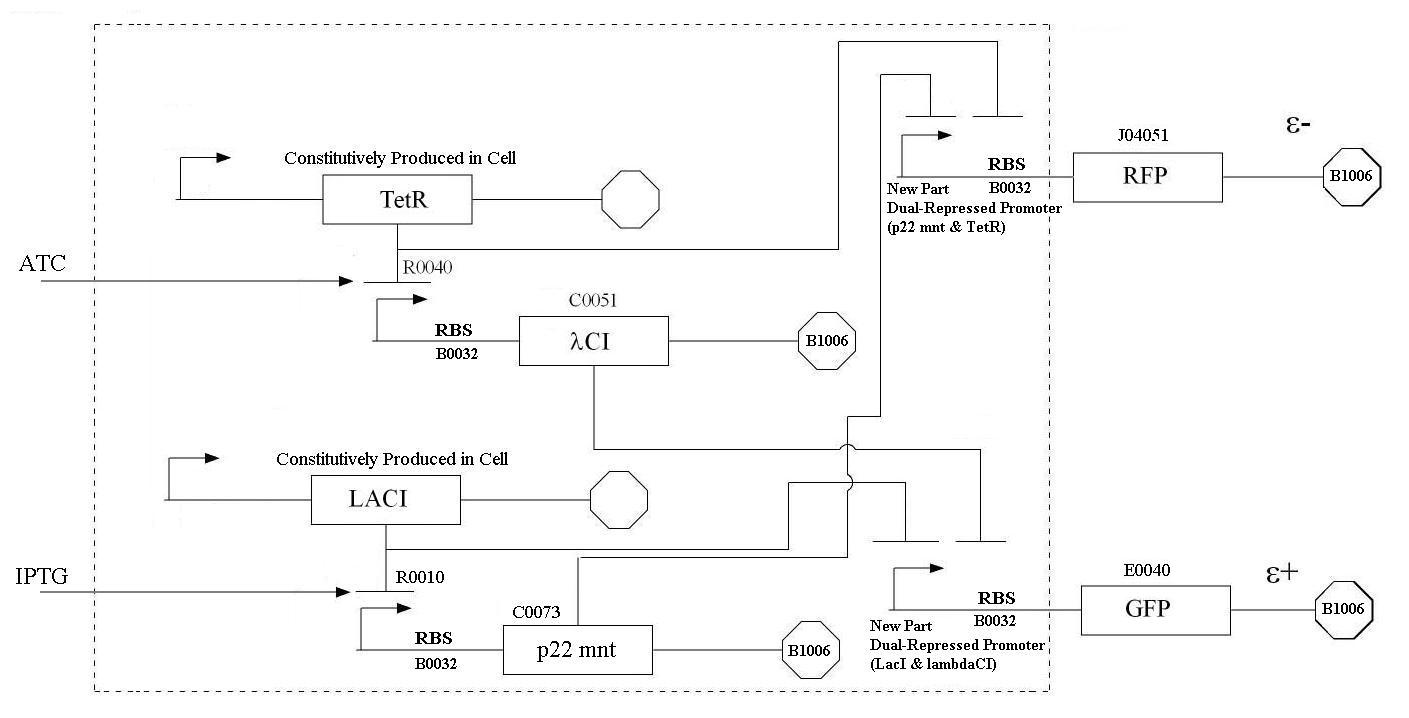
In order to undertake this task, a system involving six genes was designed. For our system, the two inputs (one representing the set point and one representing the measured value) are IPTG and ATC. These inputs will activate the transcription of the LacI and TetR proteins, and set in motion the rest of the system to produce the outputs. Depending on the amounts of the two inducer molecules added to the system, either green fluorescent protein (GFP) or red fluorescent protein(RFP) will be produced. The actual design of the system can be seen below. In order to complete this project, a total of six genes will have to be cloned into plasmids, and two new BioBrick parts will be produced. One will be a TetR and p22-MNT dual-repressed promoter, and the other will be a LacI and lambdaphage cI dual-repressed promoter. We will also build mathematical models and conduct computer simulations that will help with the designs. This project will pave the way for other parts of a true genetic PID controller to be produced, which could be an exciting scientific development in the near future.
| |
| Home | The Team | The Project | Parts Submitted to the Registry | Modeling | Notebook |
|---|
Contents |
Overall project
Control systems are an integral component of almost all aspects of life. Whether it is in industrial, biological, or chemical applications, controllers provide a way to keep systems functioning properly. A vital part of any control system is the comparator. This component compares a set point value and a measured value, and determines which is larger. It then sends the appropriate signal to the rest of the system. In typical applications, this system is electronic. However, our team set out to create a comparator using only genetic components. This comparator could potentially be used as part of a new, solely biological control system that could be used to treat many diseases afflicting humans, for example diabetes. This comparator could compare a diabetics blood sugar to what it should be, and send this result to a control system that could compensate.
In order to undertake this task, a system involving six genes was designed. For our system, the two inputs (one representing the set point and one representing the measured value) are IPTG and ATC. These inputs will activate the transcription of the LacI and TetR proteins, and set in motion the rest of the system to produce the outputs. Depending on the amounts of the two inducer molecules added to the system, either green fluorescent protein(GFP) or red fluorescent protein(RFP) will be produced. The actual design of the system can be seen below. In order to complete this project, a total of six genes will have to be cloned into plasmids, and two new BioBrick parts will be produced. One will be a TetR and p22 mnt dual-repressed promoter, and the other will be a LacI and lambdaphage cI dual-repressed promoter. This project will pave the way for other parts of a true genetic PID controller to be produced, which could be an exciting scientific development in the near future.
Project Details
| In order to design a genetic comparator, the team first looked at an electronic comparator to try to emulate it. A typical comparator has two inputs: A is the set point value, which is input into the system, and B is the measured value, which is found by measuring the controlled variable and sending this result back to the comparator. Once the comparator recieves these two values, it compares them and produces a signal. Typical this signal is positive or negative. However, for a genetic controller, there is no such thing as a negative growth, so the genetic system was forced to have two outputs, instead of the one found on typical systems. These outputs were designated epsilon+ and epsilon- to distinguish whether the signal was positive or negative. A black-box comparator can be seen below. |
| The goal of our comparator design is to take two inputs and produce an output based on the level of each input. In order for this to be accomplished, we designed the comparator such that Epsilon = A - B, where A and B are the designated inputs. If A is larger, the epsilon+ response is observed, whereas if B is larger, the epsilon- response is observed. In the rare biological case where A and B are equal, no reponse will be seen, indicating that the system is at equilibrium -- the setpoint. In our system, the epsilon+ and epsilon- responses are differentiated by being linked to fluorescent proteins. This will allow us to readily test the effectiveness and accuracy of our comparator.
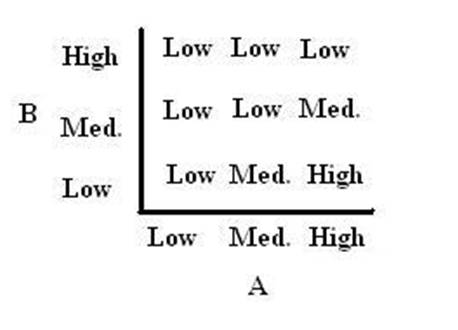
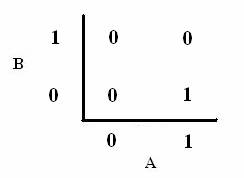
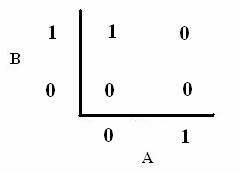
As shown below, the level of each output response can be qualitatively modeled. Partitioning the level of each input, A and B, into low, medium, and high quantities indicates the corresponding output response. Thus, only when the qualitative measurement of input B is less than that of input A will a large epsilon+ response be observed. The same applies in the case of the epsilon- response. This same idea can be translated into Boolean logic, as indicated below. Based on this logic, only when A is present and B is not, an epsilon+ response will occur. Similarly, only when B is present and A is not, the epsilon- response will be observed. |
|
From these Boolean tables, logic statements can be generated that give the response desired. These statements are shown below. |
|
Another way to state this logic, which makes it easier to design a system that generates this response, is shown below. |
| Even though these logic statements seem straightforward, the actual implementation of this logic in a biological system is actually fairly difficult. For the two inputs to the system, there are four possible states: neither A or B, more A than B, more B than A, and equal A and B. In order for the controller to be robust, it must respond correctly to each of these scenarios. This is accomplished by following the logic from the equations above. In order get the four components of the equations above (A, B, NOT A, NOT B), four genes were needed, one for each of these components. Furthermore, there must be two sets of two genes each that are linked together. NOT A and A must be linked, and NOT B and B must be as well. In order to get the NOT relationship, the gene products of A and B must repress the production of the NOT A and NOT B genes. |
Relevant Papers
|
Protocol Papers |
| Bacteria Culture Protocols |
| PCR Tutorial |
| Subcloning |
| Transformations |
| Western Blotting 1 |
| Western Blotting 2 |
|
Basic BioBrick Design |
| BioBrick Vector Design Paper |
|
Combinatorial Promoters Papers |
| Modular AND Gate |
| cis Regulatory Input |
| Combinatorial Promoters |
| Directed Evolution of AraC |
|
p22 mnt Papers |
| DNA binding specificity of the Arc and Mnt repressors |
| Bacteriophage P22 Mnt Repressor |
| The Bacteriophage P22 Arc and Mnt Repressors |
|
Light Sensor Papers |
| Chevalier Light Sensor |
| Young Light Sensor |
| Young Light Sensor (caged IPTG)
The ExperimentsResults |
 "
"
