Team:Valencia/Parts/UCP1
From 2008.igem.org
m |
|||
| (2 intermediate revisions not shown) | |||
| Line 1: | Line 1: | ||
<html><link rel="stylesheet" href="https://2008.igem.org/wiki/index.php?title=User:Joadelas/valencia.css&action=raw&ctype=text/css" type="text/css"></html> | <html><link rel="stylesheet" href="https://2008.igem.org/wiki/index.php?title=User:Joadelas/valencia.css&action=raw&ctype=text/css" type="text/css"></html> | ||
| + | __NOTOC__ | ||
{{Valencia/Menu}} | {{Valencia/Menu}} | ||
{{Valencia/Menu_Parts}} | {{Valencia/Menu_Parts}} | ||
| Line 8: | Line 9: | ||
| - | == | + | ==UCP 1== |
| Line 45: | Line 46: | ||
| - | <h3> | + | <h3> Strain growth </h3> |
Apart from monitoring temperature evolution, we also characterized O.D. variations of each of our strains. We took O.D. measures every one a half hours for nine hours. We carried out this experiment both in Erlenmeyer flasks in the 30ºC shaking stove and in our LCCs. | Apart from monitoring temperature evolution, we also characterized O.D. variations of each of our strains. We took O.D. measures every one a half hours for nine hours. We carried out this experiment both in Erlenmeyer flasks in the 30ºC shaking stove and in our LCCs. | ||
| - | |||
| - | + | ||
| + | Strain growth curve: | ||
[[Image:growthucp+.jpg|center|450px]] | [[Image:growthucp+.jpg|center|450px]] | ||
| + | |||
| + | |||
| + | |||
| + | '''Model caonstants and parameters:''' | ||
| + | |||
| + | |||
| + | The black box model simulates the temperature evolution of the system as a function of the growth rate, galactose concentration and thermogenin expresion. We assume that our system can be reproduced by the following system of equations: | ||
| + | |||
| + | [[Image:equationsmodelconstantpikachu.jpg]] | ||
| + | |||
| + | where: | ||
| + | |||
| + | * first equation: Growth of the culture: logistic growth of the different mutants used in our experiments. | ||
| + | * second equation: Galactose evolution: Galactose is the metabolite which induces the thermogenin expresion. | ||
| + | * third equation: Thermogenin concentration level. | ||
| + | * Fourth equation: Temperature evolution. the first term of the equation represents the losses to the ambient of the calorimeter and the second one the temperature increase as a consequence of the thermogenin expresion. | ||
| + | |||
| + | From a sample of 10 experiments in which the evolution of the temperature of the four strain was measured we perform a fit using the software simulink. | ||
| + | |||
| + | |||
| + | '''Common parameters values:''' | ||
| + | |||
| + | |||
| + | |||
| + | [[Image:commonparametershar.jpg|450px]] | ||
| + | |||
| + | |||
Latest revision as of 22:54, 29 October 2008
UCP 1
General information
Ucp1 is a gene which encodes for UCP1 protein.
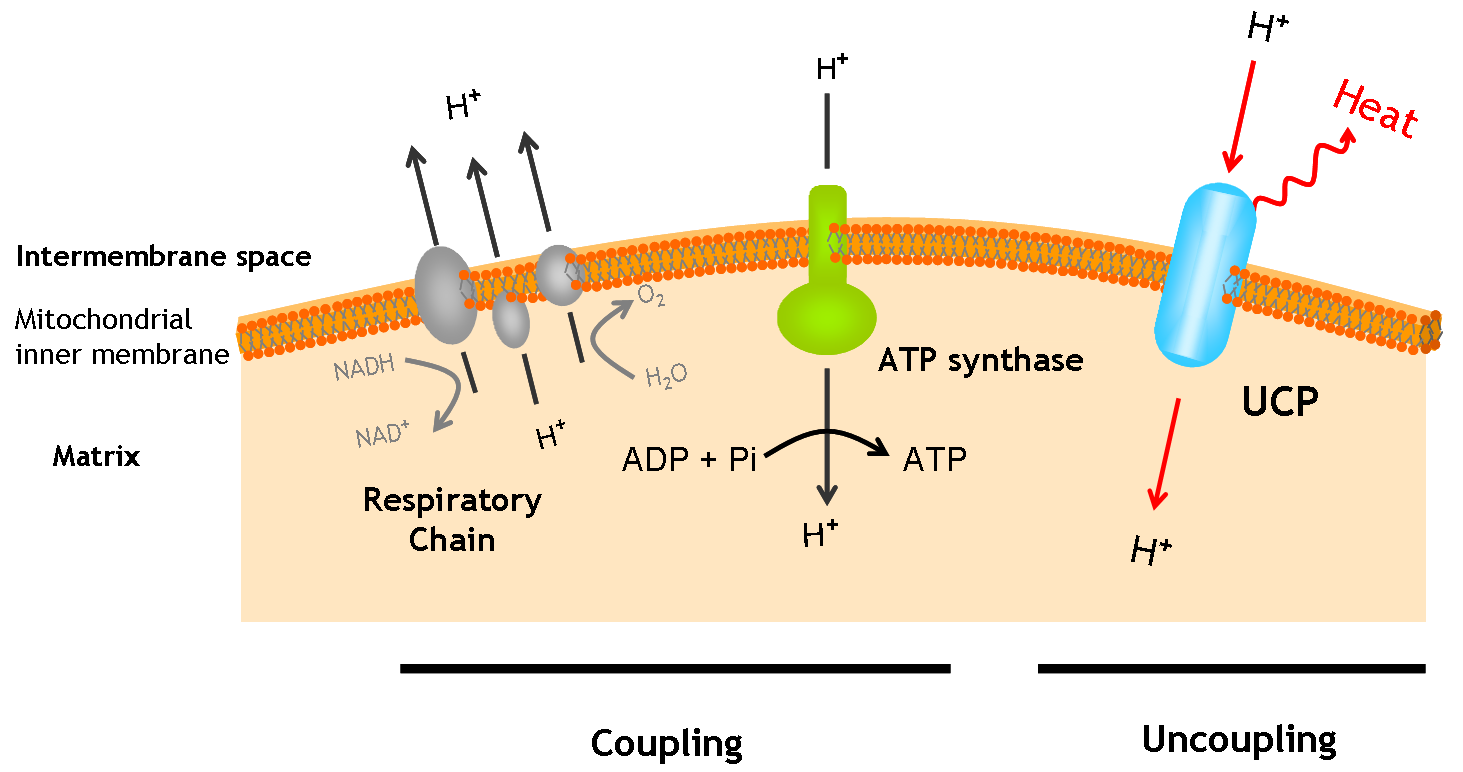
The uncoupling protein UCP1 is a proton carrier characteristic of brown adipose tissue. UCP1 uncouples the respiratory chain of ATP production, converting the metabolic energy in heat.
UCP1 is a 33kd protein which is exclusively located in the brown adipocites.
It is an integral protein present in inner mitocondrial membrane.
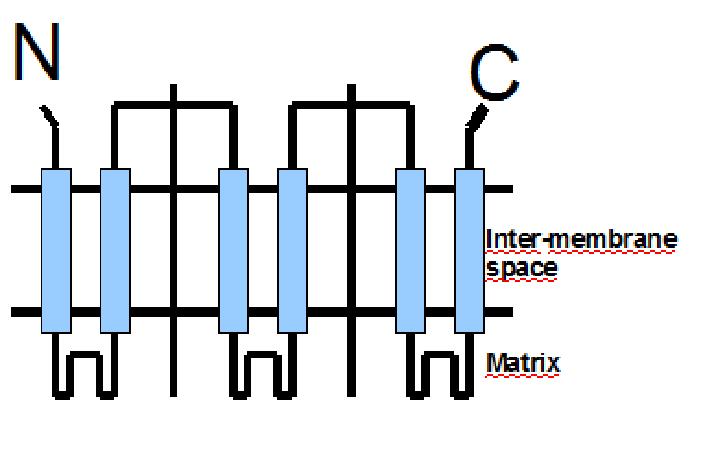
The protein has a tripartite structure. The structure displays an around 100 residues region which is three times repeated. Each part encodes for two transmembrane segments and one long hydrophilic loop.The functional carrier unit is an homodimer.

|
The main difference between UCP1 and most of the proteins with a nuclear codification is the lack of the importation targeting to the mitochondria in UCP+ proteins.
The condition that determines the mitochondria as the protein target lays in the first loop which protudes in the mitochondrial matrix.
The second loop of the matrix is essential for the insertion of the protein in the inner mitochondrial matrix. Purine nucleotides act as inhibitors of protein activity and esterificated fatty acids act as inductors.
Sequence
Strain growth
Apart from monitoring temperature evolution, we also characterized O.D. variations of each of our strains. We took O.D. measures every one a half hours for nine hours. We carried out this experiment both in Erlenmeyer flasks in the 30ºC shaking stove and in our LCCs.
Strain growth curve:
Model caonstants and parameters:
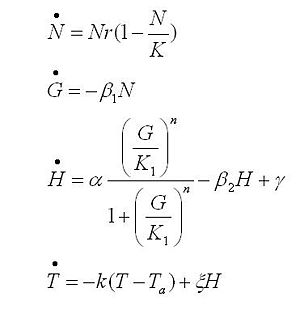
The black box model simulates the temperature evolution of the system as a function of the growth rate, galactose concentration and thermogenin expresion. We assume that our system can be reproduced by the following system of equations:
where:
- first equation: Growth of the culture: logistic growth of the different mutants used in our experiments.
- second equation: Galactose evolution: Galactose is the metabolite which induces the thermogenin expresion.
- third equation: Thermogenin concentration level.
- Fourth equation: Temperature evolution. the first term of the equation represents the losses to the ambient of the calorimeter and the second one the temperature increase as a consequence of the thermogenin expresion.
From a sample of 10 experiments in which the evolution of the temperature of the four strain was measured we perform a fit using the software simulink.
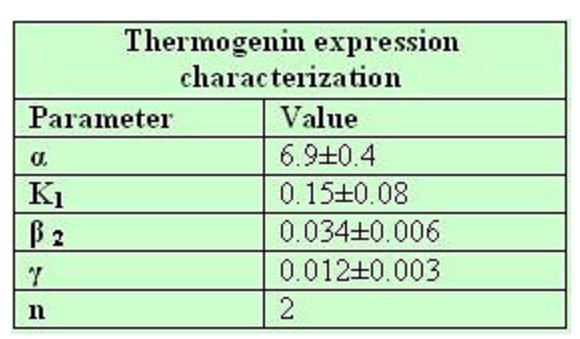
Common parameters values:
 "
"


