Team:KULeuven/Model/Output
From 2008.igem.org
(→Parameters) |
(→Position in the system) |
||
| (12 intermediate revisions not shown) | |||
| Line 1: | Line 1: | ||
| + | {{:Team:KULeuven/Tools/Styling}} | ||
| + | {{:Team:KULeuven/Tools/Scripting}} | ||
{{:Team:KULeuven/Tools/Header}} | {{:Team:KULeuven/Tools/Header}} | ||
| - | + | [[Image:pictogram_output.png|120px|right]] | |
== Output == | == Output == | ||
| Line 7: | Line 9: | ||
=== Position in the system === | === Position in the system === | ||
| - | The output system is one of three modules directly linked to the input. The output system is a simple gene regulation, of which transcription is activated by | + | The output system is one of three modules directly linked to the input. The output system is a simple gene regulation, of which transcription is repressed by TetR - and can be activated by anhydrotetracyclin. The output signal is GFP (green fluorescent protein). |
In the applied project of dealing with Crohn's disease this would be replaced by the drug necessary to cure the local inflammation. The drug concentration would be proportional to the amount of local inflammation sensed. | In the applied project of dealing with Crohn's disease this would be replaced by the drug necessary to cure the local inflammation. The drug concentration would be proportional to the amount of local inflammation sensed. | ||
| Line 21: | Line 23: | ||
<body> | <body> | ||
<p> | <p> | ||
| - | <a href="https://static.igem.org/mediawiki/2008/ | + | <a href="https://static.igem.org/mediawiki/2008/6/66/OutputODE.pdf"> |
<img border="0" src="https://2008.igem.org/wiki/skins/common/images/icons/fileicon-pdf.png" width="65" height="60"> | <img border="0" src="https://2008.igem.org/wiki/skins/common/images/icons/fileicon-pdf.png" width="65" height="60"> | ||
</a> | </a> | ||
| Line 43: | Line 45: | ||
| d<sub>LVA</sub> = 2.814E-4 s<sup>-1</sup> | | d<sub>LVA</sub> = 2.814E-4 s<sup>-1</sup> | ||
| LVA-tag reduces lifetime to 40 minutes | | LVA-tag reduces lifetime to 40 minutes | ||
| - | | [https://2008.igem.org/Team:KULeuven/Model/Output#References [1]] [https://2008.igem.org/Team:KULeuven/Model/Output#References [4]] | + | | [https://2008.igem.org/Team:KULeuven/Model/Output#References [1<html>]</html>] [https://2008.igem.org/Team:KULeuven/Model/Output#References [4<html>]</html>] |
|- | |- | ||
| d<sub>mRNA_GFP</sub> | | d<sub>mRNA_GFP</sub> | ||
| 0.0023 s<sup>-1</sup> | | 0.0023 s<sup>-1</sup> | ||
| | | | ||
| - | | [https://2008.igem.org/Team:KULeuven/Model/Output#References [2]] | + | | [https://2008.igem.org/Team:KULeuven/Model/Output#References [2<html>]</html>] |
|- | |- | ||
! colspan="4" style="border-bottom: 1px solid #003E81;" | Transcription Rates | ! colspan="4" style="border-bottom: 1px solid #003E81;" | Transcription Rates | ||
| Line 55: | Line 57: | ||
| p(TetR) dependent | | p(TetR) dependent | ||
| (GFP) between 5E-5 and 0.0125 s<sup>-1</sup> ~ [aTc] | | (GFP) between 5E-5 and 0.0125 s<sup>-1</sup> ~ [aTc] | ||
| - | | [https://2008.igem.org/Team:KULeuven/Model/Output#References [3]] | + | | [https://2008.igem.org/Team:KULeuven/Model/Output#References [3<html>]</html>] |
|- | |- | ||
! colspan="4" style="border-bottom: 1px solid #003E81;" | Translation Rates | ! colspan="4" style="border-bottom: 1px solid #003E81;" | Translation Rates | ||
| Line 62: | Line 64: | ||
| 0.167 s<sup>-1</sup> | | 0.167 s<sup>-1</sup> | ||
| translation rate for B0032 RBS (0.3 relative efficiency) | | translation rate for B0032 RBS (0.3 relative efficiency) | ||
| - | | [https://2008.igem.org/Team:KULeuven/Model/Output#References [5]] | + | | [https://2008.igem.org/Team:KULeuven/Model/Output#References [5<html>]</html>] |
|} | |} | ||
| Line 79: | Line 81: | ||
=== Simulations === | === Simulations === | ||
| - | Several simulations were conducted | + | Several simulations were conducted. The following two show the transient respons and eventual saturation of the output system to a low (left figure) and a high (right figure) input signal (TetR = 5E-5 vs 0.0125 s<sup>-1</sup>). There is a great distinction in the number of GFP molecules between the two input signals. All graphs have amounts (number of molecules in the cell) plotted vs time, measured in seconds. |
| - | + | <html> | |
| - | + | <div class="center"> | |
| + | <div class="noborder" style="width: 1050px;"> | ||
| + | <img src="https://static.igem.org/mediawiki/2008/7/74/Sim_output_1.png" style="float: left; width: 450px; height: 400px; margin: 0 15px;" /> | ||
| + | <img src="https://static.igem.org/mediawiki/2008/3/3b/Sim_output_2.png" style="float: left; width: 450px; height: 400px; margin: 0 5px;" /> | ||
| + | </div></div></html> | ||
| - | + | The next figure shows the switching behaviour of the output system to an light signal turning on and off: | |
| - | [[Image:Sim_output_3.png| | + | [[Image:Sim_output_3.png|450px|center]] |
=== Sensitivity Analysis === | === Sensitivity Analysis === | ||
| Line 93: | Line 99: | ||
=== References === | === References === | ||
| - | |||
<html xmlns="http://www.w3.org/1999/xhtml" xml:lang="en"> | <html xmlns="http://www.w3.org/1999/xhtml" xml:lang="en"> | ||
<head> | <head> | ||
| Line 101: | Line 106: | ||
<body> | <body> | ||
<table style="border-collapse:collapse;line-height:1.1em;"> | <table style="border-collapse:collapse;line-height:1.1em;"> | ||
| - | <tr style="vertical-align:top;"><td>[1]</td><td style="padding-left:4pt;">“ETHZ/Parameters - IGEM07”; | + | <tr style="vertical-align:top;"><td>[1]</td><td style="padding-left:4pt;">“ETHZ/Parameters - IGEM07”; https://2007.igem.org/ETHZ/Parameters.</td></tr> |
<tr><td colspan="2"> </td></tr> | <tr><td colspan="2"> </td></tr> | ||
<tr style="vertical-align:top;"><td>[2]</td><td style="padding-left:4pt;">J.A. Bernstein et al., “Global analysis of mRNA decay and abundance in Escherichia coli at single-gene resolution using two-color fluorescent DNA microarrays,” <span style="font-style:italic;">Proceedings of the National Academy of Sciences of the United States of America</span>, vol. 99, Jul. 2002, pp. 9697–9702. <span class="Z3988" title="url_ver=Z39.88-2004&ctx_ver=Z39.88-2004&rft_id=info%3Adoi/10.1073/pnas.112318199&rft_val_fmt=info%3Aofi%2Ffmt%3Akev%3Amtx%3Ajournal&rft.genre=article&rft.atitle=Global%20analysis%20of%20mRNA%20decay%20and%20abundance%20in%20Escherichia%20coli%20at%20single-gene%20resolution%20using%20two-color%20fluorescent%20DNA%20microarrays&rft.jtitle=Proceedings%20of%20the%20National%20Academy%20of%20Sciences%20of%20the%20United%20States%20of%20America&rft.stitle=Proc%20Natl%20Acad%20Sci%20U%20S%20A.%20&rft.volume=99&rft.issue=15&rft.aufirst=Jonathan%20A.&rft.aulast=Bernstein&rft.au=Jonathan%20A.%20Bernstein&rft.au=Arkady%20B.%20Khodursky&rft.au=Pei-Hsun%20Lin&rft.au=Sue%20Lin-Chao&rft.au=Stanley%20N.%20Cohen&rft.date=2002-07-23&rft.pages=9697%E2%80%939702"></span></td></tr> | <tr style="vertical-align:top;"><td>[2]</td><td style="padding-left:4pt;">J.A. Bernstein et al., “Global analysis of mRNA decay and abundance in Escherichia coli at single-gene resolution using two-color fluorescent DNA microarrays,” <span style="font-style:italic;">Proceedings of the National Academy of Sciences of the United States of America</span>, vol. 99, Jul. 2002, pp. 9697–9702. <span class="Z3988" title="url_ver=Z39.88-2004&ctx_ver=Z39.88-2004&rft_id=info%3Adoi/10.1073/pnas.112318199&rft_val_fmt=info%3Aofi%2Ffmt%3Akev%3Amtx%3Ajournal&rft.genre=article&rft.atitle=Global%20analysis%20of%20mRNA%20decay%20and%20abundance%20in%20Escherichia%20coli%20at%20single-gene%20resolution%20using%20two-color%20fluorescent%20DNA%20microarrays&rft.jtitle=Proceedings%20of%20the%20National%20Academy%20of%20Sciences%20of%20the%20United%20States%20of%20America&rft.stitle=Proc%20Natl%20Acad%20Sci%20U%20S%20A.%20&rft.volume=99&rft.issue=15&rft.aufirst=Jonathan%20A.&rft.aulast=Bernstein&rft.au=Jonathan%20A.%20Bernstein&rft.au=Arkady%20B.%20Khodursky&rft.au=Pei-Hsun%20Lin&rft.au=Sue%20Lin-Chao&rft.au=Stanley%20N.%20Cohen&rft.date=2002-07-23&rft.pages=9697%E2%80%939702"></span></td></tr> | ||
Latest revision as of 22:47, 29 October 2008
Contents |
Output
Position in the system
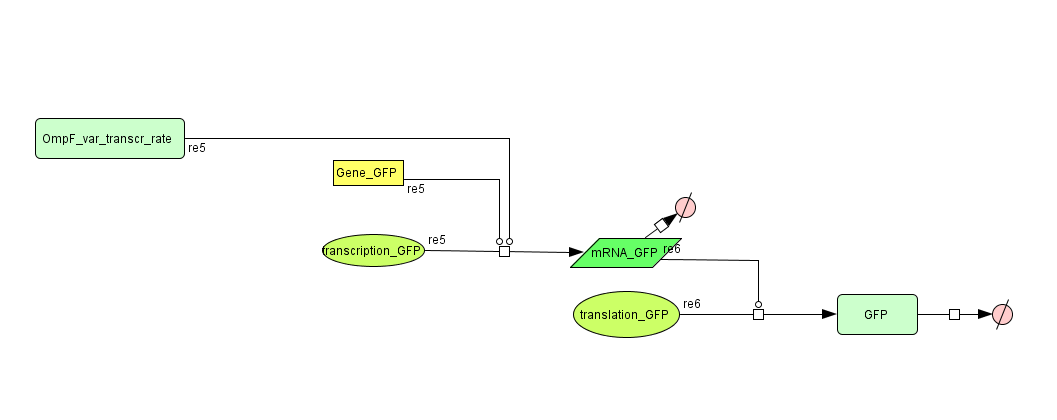
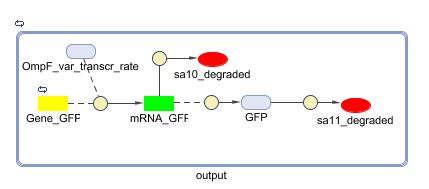
The output system is one of three modules directly linked to the input. The output system is a simple gene regulation, of which transcription is repressed by TetR - and can be activated by anhydrotetracyclin. The output signal is GFP (green fluorescent protein).
In the applied project of dealing with Crohn's disease this would be replaced by the drug necessary to cure the local inflammation. The drug concentration would be proportional to the amount of local inflammation sensed.
Describing the system
see also: Project:Output
ODE's
Parameters
| Name | Value | Comments | Reference |
|---|---|---|---|
| Degradation Rates | |||
| dGFP | dLVA = 2.814E-4 s-1 | LVA-tag reduces lifetime to 40 minutes | [1] [4] |
| dmRNA_GFP | 0.0023 s-1 | [2] | |
| Transcription Rates | |||
| TetR_var_transcr_rate | p(TetR) dependent | (GFP) between 5E-5 and 0.0125 s-1 ~ [aTc] | [3] |
| Translation Rates | |||
| kGFP | 0.167 s-1 | translation rate for B0032 RBS (0.3 relative efficiency) | [5] |
Models
CellDesigner (SBML file)
Matlab (SBML file)
Simulations
Several simulations were conducted. The following two show the transient respons and eventual saturation of the output system to a low (left figure) and a high (right figure) input signal (TetR = 5E-5 vs 0.0125 s-1). There is a great distinction in the number of GFP molecules between the two input signals. All graphs have amounts (number of molecules in the cell) plotted vs time, measured in seconds.


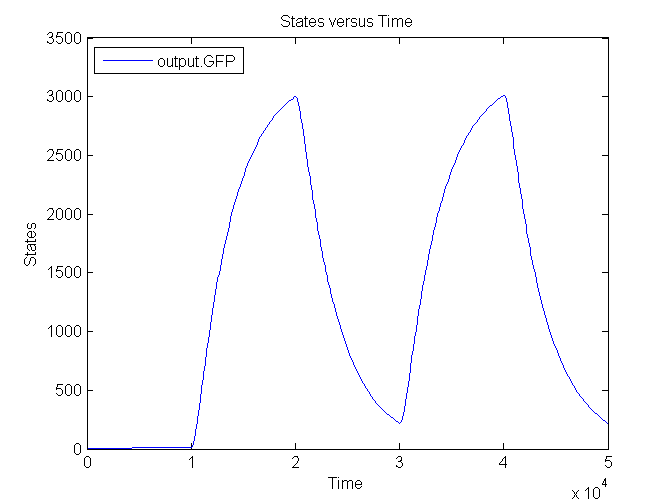
The next figure shows the switching behaviour of the output system to an light signal turning on and off:
Sensitivity Analysis
References
| [1] | “ETHZ/Parameters - IGEM07”; https://2007.igem.org/ETHZ/Parameters. |
| [2] | J.A. Bernstein et al., “Global analysis of mRNA decay and abundance in Escherichia coli at single-gene resolution using two-color fluorescent DNA microarrays,” Proceedings of the National Academy of Sciences of the United States of America, vol. 99, Jul. 2002, pp. 9697–9702. |
| [3] | M. Bon, S.J. McGowan, and P.R. Cook, “Many expressed genes in bacteria and yeast are transcribed only once per cell cycle,” FASEB J., vol. 20, Aug. 2006, pp. 1721-1723. |
| [4] | J.B. Andersen et al., “New Unstable Variants of Green Fluorescent Protein for Studies of Transient Gene Expression in Bacteria,” Applied and Environmental Microbiology, vol. 64, Jun. 1998, pp. 2240–2246. |
| [5] | “Part:BBa B0032 - partsregistry.org”; http://partsregistry.org/Part:BBa_B0032. |
 "
"


