Team:KULeuven/Data/GFP
From 2008.igem.org
m (→Materials and methods) |
(logo) |
||
| (7 intermediate revisions not shown) | |||
| Line 1: | Line 1: | ||
| + | {{:Team:KULeuven/Tools/Styling}} | ||
| + | {{:Team:KULeuven/Tools/Scripting}} | ||
{{:Team:KULeuven/Tools/Header}} | {{:Team:KULeuven/Tools/Header}} | ||
| + | |||
| + | [[Image:logo-GFP.jpg|120px|right]] | ||
==GFP with LVA-tag== | ==GFP with LVA-tag== | ||
[http://partsregistry.org/wiki/index.php?title=Part:BBa_K145015 Parts Registry:K145015] | [http://partsregistry.org/wiki/index.php?title=Part:BBa_K145015 Parts Registry:K145015] | ||
| + | |||
| + | ===Introduction=== | ||
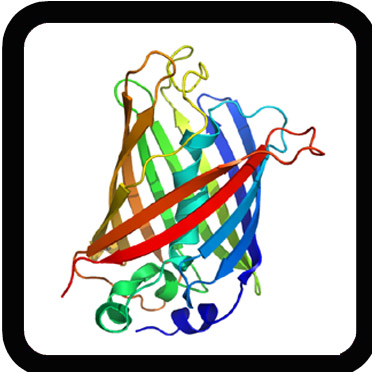
| + | ''Green fluorescent protein'' (GFP) is often used as a reporter protein, because it allows easy and nondestructive in situ monitoring of cellular processes. It can be expressed in a wide range of organisms and it doesn’t require the addition of a special substrate in order to detect green fluorescence. Nevertheless, the protein has one major drawback, it seems to be very stable. Once the expression of GFP is started, it will fluoresce for a very long period of time. This makes GFP unsuitable for monitoring rapid changes in gene expression. However, in our project fast changes of input will lead to fast changes of output. It is therefore of the utmost importance that we can easily monitor these changes. Andersen et al. [https://2008.igem.org/Team:KULeuven/Data/GFP#References [1<html>]</html>] had already indicated that proper tagging of GFP will make the protein less stable. These researchers showed that a so-called LVA tag seemed to be the most efficient tag to make GFP unstable. This tag consists of a short peptide sequence (AANDENYALVA) and is attached to the C-terminal end of GFP. It is believed that the LVA tag renders GFP susceptible to the action of tail-specific proteases, namely Tsp protease in the periplasm and ClpXP and ClpAP in the cytoplasm of ''E.coli'' [https://2008.igem.org/Team:KULeuven/Data/GFP#References [2<html>]</html>]. | ||
| + | |||
| + | Since we have to monitor the variability of the gene expressions in our system, we decided to employ this fast degradable GFP mutant. We therefore transformed GFP with LVA tag into a BioBrick and characterized it with ''fluorescence-activated cell sorting'' (FACS). | ||
| + | |||
===Materials and methods=== | ===Materials and methods=== | ||
| - | + | ||
| - | [http://partsregistry.org/ | + | ==== Media ==== |
| + | |||
| + | The media used were Luria-Bertani (LB) medium or ABT minimal medium. LB medium was used to make liquid cultures (composition on [http://openwetware.org/wiki/LB OWW]). ABT medium is a minimal AB medium (composition on [http://openwetware.org/wiki/AB_medium OWW]) containing 2.5 mg of thiamine per liter [https://2008.igem.org/Team:KULeuven/Data/GFP#References [1<html>]</html>]. This ABT medium was used in our fluorescence measurements. Because ABT medium is a minimal medium, the production of new GFP stops and the degradation of GFP becomes detectable. | ||
| + | |||
| + | ==== Constructing plasmids ==== | ||
| + | |||
| + | First, we had to make a GFP with LVA tag in conformity to the BioBrick standard. Therefore we conducted a PCR with ''pfx'' polymerase on a plasmid containing the coding region of GFP-LVA that was given to us by Molin et al [https://2008.igem.org/Team:KULeuven/Data/GFP#References [1<html>]</html>]. The primers that we used were built such that they would add a BioBrick prefix and suffix to the coding region of GFP-LVA (see below). This PCR product was then digested with ''Eco''RI and ''Spe''I. This digest was subsequently ligated into a pSB1A2 plasmid with T4 DNA ligase. Then we electroporated this ligation mix and obtained thus an ''E.coli'' strain containing [http://partsregistry.org/Part:BBa_K145015 K145015]. | ||
| + | <div style="margin-left:90px;"> Forward primer : CATCATGAAT TCGCGGCCGC TTCTAGATGC GTAAAGGAGA AGAACTTTTC ACTGG</div> | ||
| + | <div style="margin-left:90px;"> Reverse primer : CTGCAGCGGC CGCTACTAGT ATTATTAAGC TACTAAAGCG TAGTTTTCGT CGTTTGCAGC AGGC</div><br> | ||
| + | |||
| + | Now that we had a GFP-LVA BioBrick, we could construct a test module using the BioBrick Standard Assembly method. The test modules contain a promoter, RBS, coding region and terminator to allow the expression of GFP. We made the following constructs : | ||
| + | {|style="background:#ffffff; text-align:center; width:80%" | ||
| + | |[[Image:K145205.JPG|center]] || [[Image:K145252.JPG|center]] | ||
| + | |- | ||
| + | |[http://partsregistry.org/Part:BBa_K145205 K145205] || [http://partsregistry.org/Part:BBa_I7101 I7101] | ||
| + | |} | ||
| + | <br> | ||
| + | |||
| + | To make these constructs we miniprepped [http://partsregistry.org/Part:BBa_R0040 R0040], [http://partsregistry.org/Part:BBa_B0032 B0032], [http://partsregistry.org/Part:BBa_K145015 K14015], [http://partsregistry.org/Part:BBa_B0015 B0015] and [http://partsregistry.org/Part:BBa_E0240 E0240]. After that R0040 was digested with ''Eco''RI and ''Spe''I, B0032 with ''Eco''RI and ''Xba''I, K145015 with ''Pst''I and ''Spe''I, B0015 with ''Xba''I and ''Pst''I, and E0240 with ''Eco''RI and ''Xba''I. We ligated some of these digests with T4 DNA polymerase : R0040+B0032, K145015+B0015 and R0040+E0240. These ligations were then electroporated into Top10 cells and the obtained colonies were miniprepped. R0040+B0032 was then cut with ''Eco''RI and ''Spe''I and K145015+B0015 was cut with ''Eco''RI and ''Xba''I. These digests were ligated to obtain part [http://partsregistry.org/Part:BBa_K145205 K145205] : (R0040+B0032)+(K145015+B0015). A schematic of this ligation procedure is shown below : | ||
| + | |||
| + | [[image:Scheme-K145205.jpg|centre|870px]] | ||
| + | |||
| + | ==== Measuring fluorescence of single cells ==== | ||
| + | |||
| + | Electrocompetent Top10 cells were electroporated with K145205, I7101 and pUC18. These cells were plated out on agar plates with ampicillin and grown overnight (37°). From this, a 5ml liquid culture supplied with 100 µg ampicillin / ml was prepared and also grown overnight (37°C). These cells were inoculated in fresh LB medium (100 µg ampicillin / ml) in the morning and grown at 37°C for 3.5h. They were then washed in preheated (37°C) ABT minimal medium and resuspended in 5ml of fresh ABT medium. After that, the cells were whithdrawn at different time intervals. They were diluted into PBS and analyzed by flow cytometry with a Becton Dickinson FACSCalibur and CELLQuest<sup>TM</sup> acquisition and analysis software with gates set to forward and side scatters characteristic of the bacteria (Gate G2=R2). We decided upon using FACS because then the fluorescence of single cells is measured. Since each time the fluorescence of 10,000 individual cells is measured, FACS allows more elaborate and accurate statistical analysis. | ||
| + | |||
| + | This method is based on the paper of Andersen et al. [https://2008.igem.org/Team:KULeuven/Data/GFP#References [1<html>]</html>] | ||
| + | |||
| + | |||
| + | ===Results and discussion=== | ||
| + | The construction of the plasmids didn’t cause any difficulties. Sequencing showed that K145205 contained the GFP with LVA tag and that I7101 contained GFP(mut3b). The colonies of the bacteria were already fluorescent, which also proved that the constructs worked. We did have some problems with the liquid cultures. At first we couldn’t detect any fluorescence in the overnight liquid cultures of GFP-LVA. We found out that this was due to the fact that the cells were already in a stationary growth phase and that GFP-LVA was already degraded. Fluorescence could be measured when using cells in an early logaritmic growth phase. | ||
| + | |||
| + | Our measurements were done in double (biological repeat) : we made a liquid culture of 2 colonies of K145205, 2 colonies of I7101 and 1 colony of pUC18. When the ''E.coli'' Top10 cells were in a early logaritmic growth phase, they were transferred into ABT medium. After 0, 15, 30, 45, 60, 80, 100, 120, 140, 160, 185, 215, 240, 1205, 1545 and 2760 minutes the fluorescence was measured with FACS. With CELLQuest<sup>TM</sup> analysis software a histogram of the fluorescence (channel FL1-H) was made and the mean and standard deviation of the fluorescence were calculated. An extensive overview of the measurements can be found [https://static.igem.org/mediawiki/2008/d/da/FACS.pdf here]. | ||
| + | |||
| + | The average fluorescence was then corrected for background by substracting the average fluorescence measured with pUC18. The results were subsequently converted to relative fluorescence – with the fluorescence at time zero arbitrarely set to 100%. A graph was made of the relative fluorescence as a function of time. The graph of the first colonies can be found below. | ||
| + | |||
| + | {|style="background:#ffffff; text-align:center; width:80%" | ||
| + | |[[Image:Data-GFP(1)b.JPG|center]] | ||
| + | |-align=justify | ||
| + | |<sup> Graphs of the relative fluorescence of GFP(mut3b) and GFP-LVA as a function of time. Only the data of one of the biological repeats are shown. ''Graph A'' contains the data obtained over a long period of time (0-2800 min). ''Graph B'' is an enlarged piece of graph A, containing only the data from 0 to 240 minutes.</sup> | ||
| + | |} | ||
| + | <br> | ||
| + | |||
| + | Because we had a biological repeat, we obtained two graphs. They were however very similar. A more accurate result was obtained by calculating the mean of both measurements. A graphical representation can be found at the bottom of this page. Our measurements were spread over three days. The fluorescence of GFP-LVA dropped almost to zero during the first day (time 0 - 240 minutes), but the fluorescence of GFP(mut3b) was still very high. Only after almost three days the fluorescence of this GFP(mut3b) had dropped considerably. To obtain relevant results, we therefore fitted an exponential curve through to graph of GFP-LVA within the short time range (0 – 240 minutes) and through the graph of GFP within the longer time range (0 – 2800 minutes). From these fitted curves the half-lifes were calculated. | ||
| + | |||
| + | The obtained half-life of GFP-LVA (approximately 74 min) is considerably lower then the half-life of GFP(mut3b) (approximately 2475 min or 41,25h), hereby showing the effectiveness of the LVA tag. However, this half-life of GFP-LVA is still almost twice as large as the one calculated by Andersen et al. (approximately 40 min) [https://2008.igem.org/Team:KULeuven/Data/GFP#References [1<html>]</html>]. Nevertheless, it has been made clear that our part K145015 behaves as expected, i.e. it fluoresces and is degraded much faster then GFP without a tag. | ||
| + | |||
| + | {|style="background:#ffffff; text-align:center; width:80%" | ||
| + | |[[Image:Data-GFP(2)b.JPG|center]] | ||
| + | |-align=justify | ||
| + | |<sup> Graphs of the relative fluorescence of GFP(mut3b) and GFP-LVA as a function of time - average of the two biological repeats (semilogaritmic scale). ''Graph A'' contains the data obtained over a long period of time (0-2800 min). The equation was obtained by an exponential fit through the data of GFP. The half-life of GFP was calculated using this equation (y=100exp(-0.00028x), where y is the relative fluorescence (%) and x is time (min)). ''Graph B'' is an enlarged piece of graph A, containing only the data from 0 to 240 minutes. The equation was obtained by an exponential fit through the data of GFP-LVA. The half-life of GFP-LVA was calculated using this equation (y=100exp(-0.00937x), where y is the relative fluorescence (%) and x is time (min)).</sup> | ||
| + | |} | ||
| + | <br> | ||
| + | |||
| + | ===References=== | ||
| + | {|style="margin-left:50px;" | ||
| + | |-style="vertical-align:top;" | ||
| + | |width=30px| [1] | ||
| + | |height=50px; align=justify|J.B. Andersen et al., “New Unstable Variants of Green Fluorescent Protein for Studies of Transient Gene Expression in Bacteria,” ''Applied and Environmental Microbiology'', vol. 64, Jun. 1998, pp. 2240–2246. [http://www.pubmedcentral.nih.gov/articlerender.fcgi?tool=pubmed&pubmedid=9603842 article] | ||
| + | |-style="vertical-align:top;" | ||
| + | |width=30px|[2] | ||
| + | |height=50px; align=justify|A.W. Karzai et al., "The SsrA−SmpB system for protein tagging, directed degradation and ribosome rescue", ''Nature Structural Biology'', vol. 7, 2000, pp. 449 - 455. [http://www.nature.com/nsmb/journal/v7/n6/full/nsb0600_449.html article] | ||
| + | |} | ||
Latest revision as of 15:41, 19 October 2008
Contents |
GFP with LVA-tag
[http://partsregistry.org/wiki/index.php?title=Part:BBa_K145015 Parts Registry:K145015]
Introduction
Green fluorescent protein (GFP) is often used as a reporter protein, because it allows easy and nondestructive in situ monitoring of cellular processes. It can be expressed in a wide range of organisms and it doesn’t require the addition of a special substrate in order to detect green fluorescence. Nevertheless, the protein has one major drawback, it seems to be very stable. Once the expression of GFP is started, it will fluoresce for a very long period of time. This makes GFP unsuitable for monitoring rapid changes in gene expression. However, in our project fast changes of input will lead to fast changes of output. It is therefore of the utmost importance that we can easily monitor these changes. Andersen et al. [1] had already indicated that proper tagging of GFP will make the protein less stable. These researchers showed that a so-called LVA tag seemed to be the most efficient tag to make GFP unstable. This tag consists of a short peptide sequence (AANDENYALVA) and is attached to the C-terminal end of GFP. It is believed that the LVA tag renders GFP susceptible to the action of tail-specific proteases, namely Tsp protease in the periplasm and ClpXP and ClpAP in the cytoplasm of E.coli [2].
Since we have to monitor the variability of the gene expressions in our system, we decided to employ this fast degradable GFP mutant. We therefore transformed GFP with LVA tag into a BioBrick and characterized it with fluorescence-activated cell sorting (FACS).
Materials and methods
Media
The media used were Luria-Bertani (LB) medium or ABT minimal medium. LB medium was used to make liquid cultures (composition on [http://openwetware.org/wiki/LB OWW]). ABT medium is a minimal AB medium (composition on [http://openwetware.org/wiki/AB_medium OWW]) containing 2.5 mg of thiamine per liter [1]. This ABT medium was used in our fluorescence measurements. Because ABT medium is a minimal medium, the production of new GFP stops and the degradation of GFP becomes detectable.
Constructing plasmids
First, we had to make a GFP with LVA tag in conformity to the BioBrick standard. Therefore we conducted a PCR with pfx polymerase on a plasmid containing the coding region of GFP-LVA that was given to us by Molin et al [1]. The primers that we used were built such that they would add a BioBrick prefix and suffix to the coding region of GFP-LVA (see below). This PCR product was then digested with EcoRI and SpeI. This digest was subsequently ligated into a pSB1A2 plasmid with T4 DNA ligase. Then we electroporated this ligation mix and obtained thus an E.coli strain containing [http://partsregistry.org/Part:BBa_K145015 K145015].
Now that we had a GFP-LVA BioBrick, we could construct a test module using the BioBrick Standard Assembly method. The test modules contain a promoter, RBS, coding region and terminator to allow the expression of GFP. We made the following constructs :
| [http://partsregistry.org/Part:BBa_K145205 K145205] | [http://partsregistry.org/Part:BBa_I7101 I7101] |
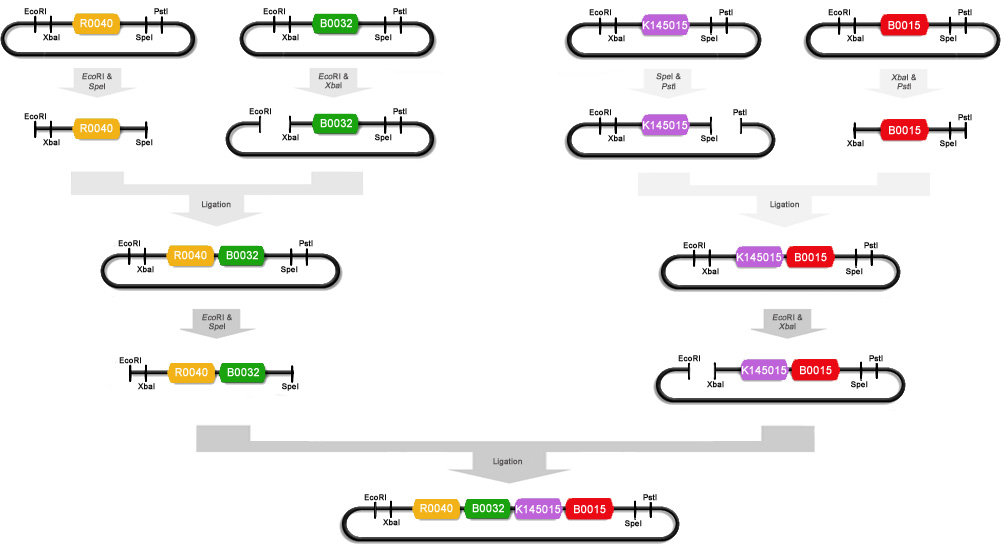
To make these constructs we miniprepped [http://partsregistry.org/Part:BBa_R0040 R0040], [http://partsregistry.org/Part:BBa_B0032 B0032], [http://partsregistry.org/Part:BBa_K145015 K14015], [http://partsregistry.org/Part:BBa_B0015 B0015] and [http://partsregistry.org/Part:BBa_E0240 E0240]. After that R0040 was digested with EcoRI and SpeI, B0032 with EcoRI and XbaI, K145015 with PstI and SpeI, B0015 with XbaI and PstI, and E0240 with EcoRI and XbaI. We ligated some of these digests with T4 DNA polymerase : R0040+B0032, K145015+B0015 and R0040+E0240. These ligations were then electroporated into Top10 cells and the obtained colonies were miniprepped. R0040+B0032 was then cut with EcoRI and SpeI and K145015+B0015 was cut with EcoRI and XbaI. These digests were ligated to obtain part [http://partsregistry.org/Part:BBa_K145205 K145205] : (R0040+B0032)+(K145015+B0015). A schematic of this ligation procedure is shown below :
Measuring fluorescence of single cells
Electrocompetent Top10 cells were electroporated with K145205, I7101 and pUC18. These cells were plated out on agar plates with ampicillin and grown overnight (37°). From this, a 5ml liquid culture supplied with 100 µg ampicillin / ml was prepared and also grown overnight (37°C). These cells were inoculated in fresh LB medium (100 µg ampicillin / ml) in the morning and grown at 37°C for 3.5h. They were then washed in preheated (37°C) ABT minimal medium and resuspended in 5ml of fresh ABT medium. After that, the cells were whithdrawn at different time intervals. They were diluted into PBS and analyzed by flow cytometry with a Becton Dickinson FACSCalibur and CELLQuestTM acquisition and analysis software with gates set to forward and side scatters characteristic of the bacteria (Gate G2=R2). We decided upon using FACS because then the fluorescence of single cells is measured. Since each time the fluorescence of 10,000 individual cells is measured, FACS allows more elaborate and accurate statistical analysis.
This method is based on the paper of Andersen et al. [1]
Results and discussion
The construction of the plasmids didn’t cause any difficulties. Sequencing showed that K145205 contained the GFP with LVA tag and that I7101 contained GFP(mut3b). The colonies of the bacteria were already fluorescent, which also proved that the constructs worked. We did have some problems with the liquid cultures. At first we couldn’t detect any fluorescence in the overnight liquid cultures of GFP-LVA. We found out that this was due to the fact that the cells were already in a stationary growth phase and that GFP-LVA was already degraded. Fluorescence could be measured when using cells in an early logaritmic growth phase.
Our measurements were done in double (biological repeat) : we made a liquid culture of 2 colonies of K145205, 2 colonies of I7101 and 1 colony of pUC18. When the E.coli Top10 cells were in a early logaritmic growth phase, they were transferred into ABT medium. After 0, 15, 30, 45, 60, 80, 100, 120, 140, 160, 185, 215, 240, 1205, 1545 and 2760 minutes the fluorescence was measured with FACS. With CELLQuestTM analysis software a histogram of the fluorescence (channel FL1-H) was made and the mean and standard deviation of the fluorescence were calculated. An extensive overview of the measurements can be found here.
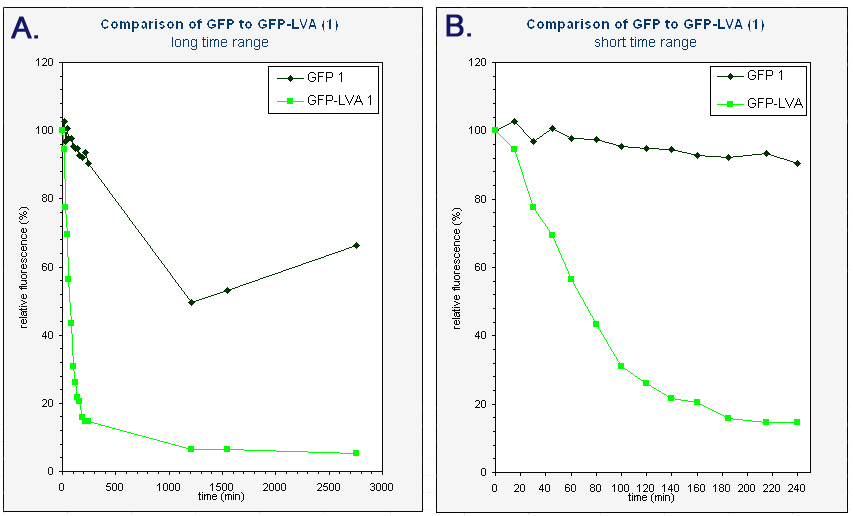
The average fluorescence was then corrected for background by substracting the average fluorescence measured with pUC18. The results were subsequently converted to relative fluorescence – with the fluorescence at time zero arbitrarely set to 100%. A graph was made of the relative fluorescence as a function of time. The graph of the first colonies can be found below.
| Graphs of the relative fluorescence of GFP(mut3b) and GFP-LVA as a function of time. Only the data of one of the biological repeats are shown. Graph A contains the data obtained over a long period of time (0-2800 min). Graph B is an enlarged piece of graph A, containing only the data from 0 to 240 minutes. |
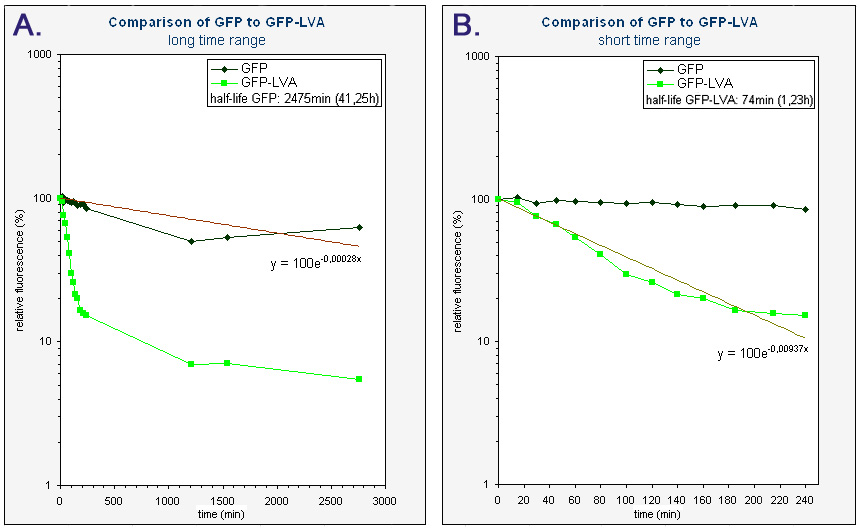
Because we had a biological repeat, we obtained two graphs. They were however very similar. A more accurate result was obtained by calculating the mean of both measurements. A graphical representation can be found at the bottom of this page. Our measurements were spread over three days. The fluorescence of GFP-LVA dropped almost to zero during the first day (time 0 - 240 minutes), but the fluorescence of GFP(mut3b) was still very high. Only after almost three days the fluorescence of this GFP(mut3b) had dropped considerably. To obtain relevant results, we therefore fitted an exponential curve through to graph of GFP-LVA within the short time range (0 – 240 minutes) and through the graph of GFP within the longer time range (0 – 2800 minutes). From these fitted curves the half-lifes were calculated.
The obtained half-life of GFP-LVA (approximately 74 min) is considerably lower then the half-life of GFP(mut3b) (approximately 2475 min or 41,25h), hereby showing the effectiveness of the LVA tag. However, this half-life of GFP-LVA is still almost twice as large as the one calculated by Andersen et al. (approximately 40 min) [1]. Nevertheless, it has been made clear that our part K145015 behaves as expected, i.e. it fluoresces and is degraded much faster then GFP without a tag.
| Graphs of the relative fluorescence of GFP(mut3b) and GFP-LVA as a function of time - average of the two biological repeats (semilogaritmic scale). Graph A contains the data obtained over a long period of time (0-2800 min). The equation was obtained by an exponential fit through the data of GFP. The half-life of GFP was calculated using this equation (y=100exp(-0.00028x), where y is the relative fluorescence (%) and x is time (min)). Graph B is an enlarged piece of graph A, containing only the data from 0 to 240 minutes. The equation was obtained by an exponential fit through the data of GFP-LVA. The half-life of GFP-LVA was calculated using this equation (y=100exp(-0.00937x), where y is the relative fluorescence (%) and x is time (min)). |
References
| [1] | J.B. Andersen et al., “New Unstable Variants of Green Fluorescent Protein for Studies of Transient Gene Expression in Bacteria,” Applied and Environmental Microbiology, vol. 64, Jun. 1998, pp. 2240–2246. [http://www.pubmedcentral.nih.gov/articlerender.fcgi?tool=pubmed&pubmedid=9603842 article] |
| [2] | A.W. Karzai et al., "The SsrA−SmpB system for protein tagging, directed degradation and ribosome rescue", Nature Structural Biology, vol. 7, 2000, pp. 449 - 455. [http://www.nature.com/nsmb/journal/v7/n6/full/nsb0600_449.html article] |
 "
"


