Team:Bologna/Software
From 2008.igem.org
(→Visual Fluo Bacteria: a software for the analysis of fluorescence bacteria image) |
(Note goods insipidus: factures, intracellular surgeons.) |
||
| (53 intermediate revisions not shown) | |||
| Line 24: | Line 24: | ||
<div style="text-align:justify"> | <div style="text-align:justify"> | ||
| - | = Visual Fluo Bacteria: a software for the analysis of | + | = Visual Fluo Bacteria: a software for the analysis of bacteria fluorescence images = |
__FORCETOC__ | __FORCETOC__ | ||
| - | + | Image of fluorescence bacteria is commonly used to visualize the activity of genetically engineered bacteria (see Figure 1). | |
| - | + | ||
<br> | <br> | ||
| - | [[Image:field.jpg|200px|thumbnail|Figure 1 | + | [[Image:field.jpg|200px|thumbnail|Figure 1. Fluorescence field|center]] |
<br> | <br> | ||
| - | + | Bacteria fluorescence imagines can be obtained by optical microscopy with a ccd camera. We develop a matlab tool to analyze such kind of bacterium imagine that can be acquired in different format (jpg, bpm, tiff). The software initially segments bacteria and then computed their number. For each segmented bacteria the software computes the size in pixel, the mean and standard deviation of
intensity florescence. The use of the software is easy and intuitive (see user interface in Figure 2). | |
| - | + | ||
| - | The use of the software is easy and intuitive. | + | |
<br> | <br> | ||
| - | [[Image:Screenshot.jpg|thumbnail|500px|Figure 2 | + | [[Image:Screenshot.jpg|thumbnail|500px|Figure 2. Main frame|center]] |
<br> | <br> | ||
| - | The algorithm reads fluorescence images and converts it into a "black and white" one. Then the image is filtered by Top Hat filter to correct uneven illumination when the background is dark. In the next step the global threshold is computed in order to convert an intensity image to a binary image using Otsu’s method. The image is then ready to be scanned, pixel by pixel, to detect bacteria (cluster of pixels) and obtain informations about their area, fluorescence mean and standard deviation. Fluorescence is read from R channel for RFP, G for GFP and B for CFP. | + | The algorithm reads fluorescence images and converts it into a "black and white" one. Then the image is filtered by Top Hat filter to correct uneven illumination when the background is dark. In the next step the global threshold is computed in order to convert an intensity image to a binary image using Otsu’s method. The image is then ready to be scanned, pixel by pixel, to detect bacteria (cluster of pixels) and obtain informations about their area, fluorescence mean and standard deviation. Fluorescence is read from R channel for RFP, G for GFP and B for CFP. The software allows to filter imagine by neglecting the bacteria that have morphologic parameters out of a prefixed range. The user can set two indicators:<br> |
| - | + | ||
| - | + | ||
| - | + | ||
* Area dimension range ( definite by a superior and an inferior limit): This range defers to selected the bacteria that have similar size. | * Area dimension range ( definite by a superior and an inferior limit): This range defers to selected the bacteria that have similar size. | ||
* Fluorescence intensity ( definite by the std\mean ratio referred to each bacteria): this values consent to throw away the bacteria that lie on another focal layer or that aren’t focused correctly. | * Fluorescence intensity ( definite by the std\mean ratio referred to each bacteria): this values consent to throw away the bacteria that lie on another focal layer or that aren’t focused correctly. | ||
| Line 61: | Line 55: | ||
{| align=center | {| align=center | ||
| - | |[[Image:before.jpg|200px|thumbnail|Image before filtering]] | + | |[[Image:before.jpg|200px|thumbnail|Figure 3. Image before filtering]] |
|[[Image:freccia.jpg|200px]] | |[[Image:freccia.jpg|200px]] | ||
| - | |[[Image:after.jpg|200px|thumbnail|Image after filtering]] | + | |[[Image:after.jpg|200px|thumbnail|Figure 4. Image after filtering]] |
|} | |} | ||
| Line 78: | Line 72: | ||
<br> | <br> | ||
[[Image:adobe.jpg|30px]][[Media:UserManual.pdf|User Manual]] | [[Image:adobe.jpg|30px]][[Media:UserManual.pdf|User Manual]] | ||
| + | |||
[https://2008.igem.org/Team:Bologna/Software ''Up''] | [https://2008.igem.org/Team:Bologna/Software ''Up''] | ||
| Line 83: | Line 78: | ||
== Microscopy system for fluorescence image acquisition == | == Microscopy system for fluorescence image acquisition == | ||
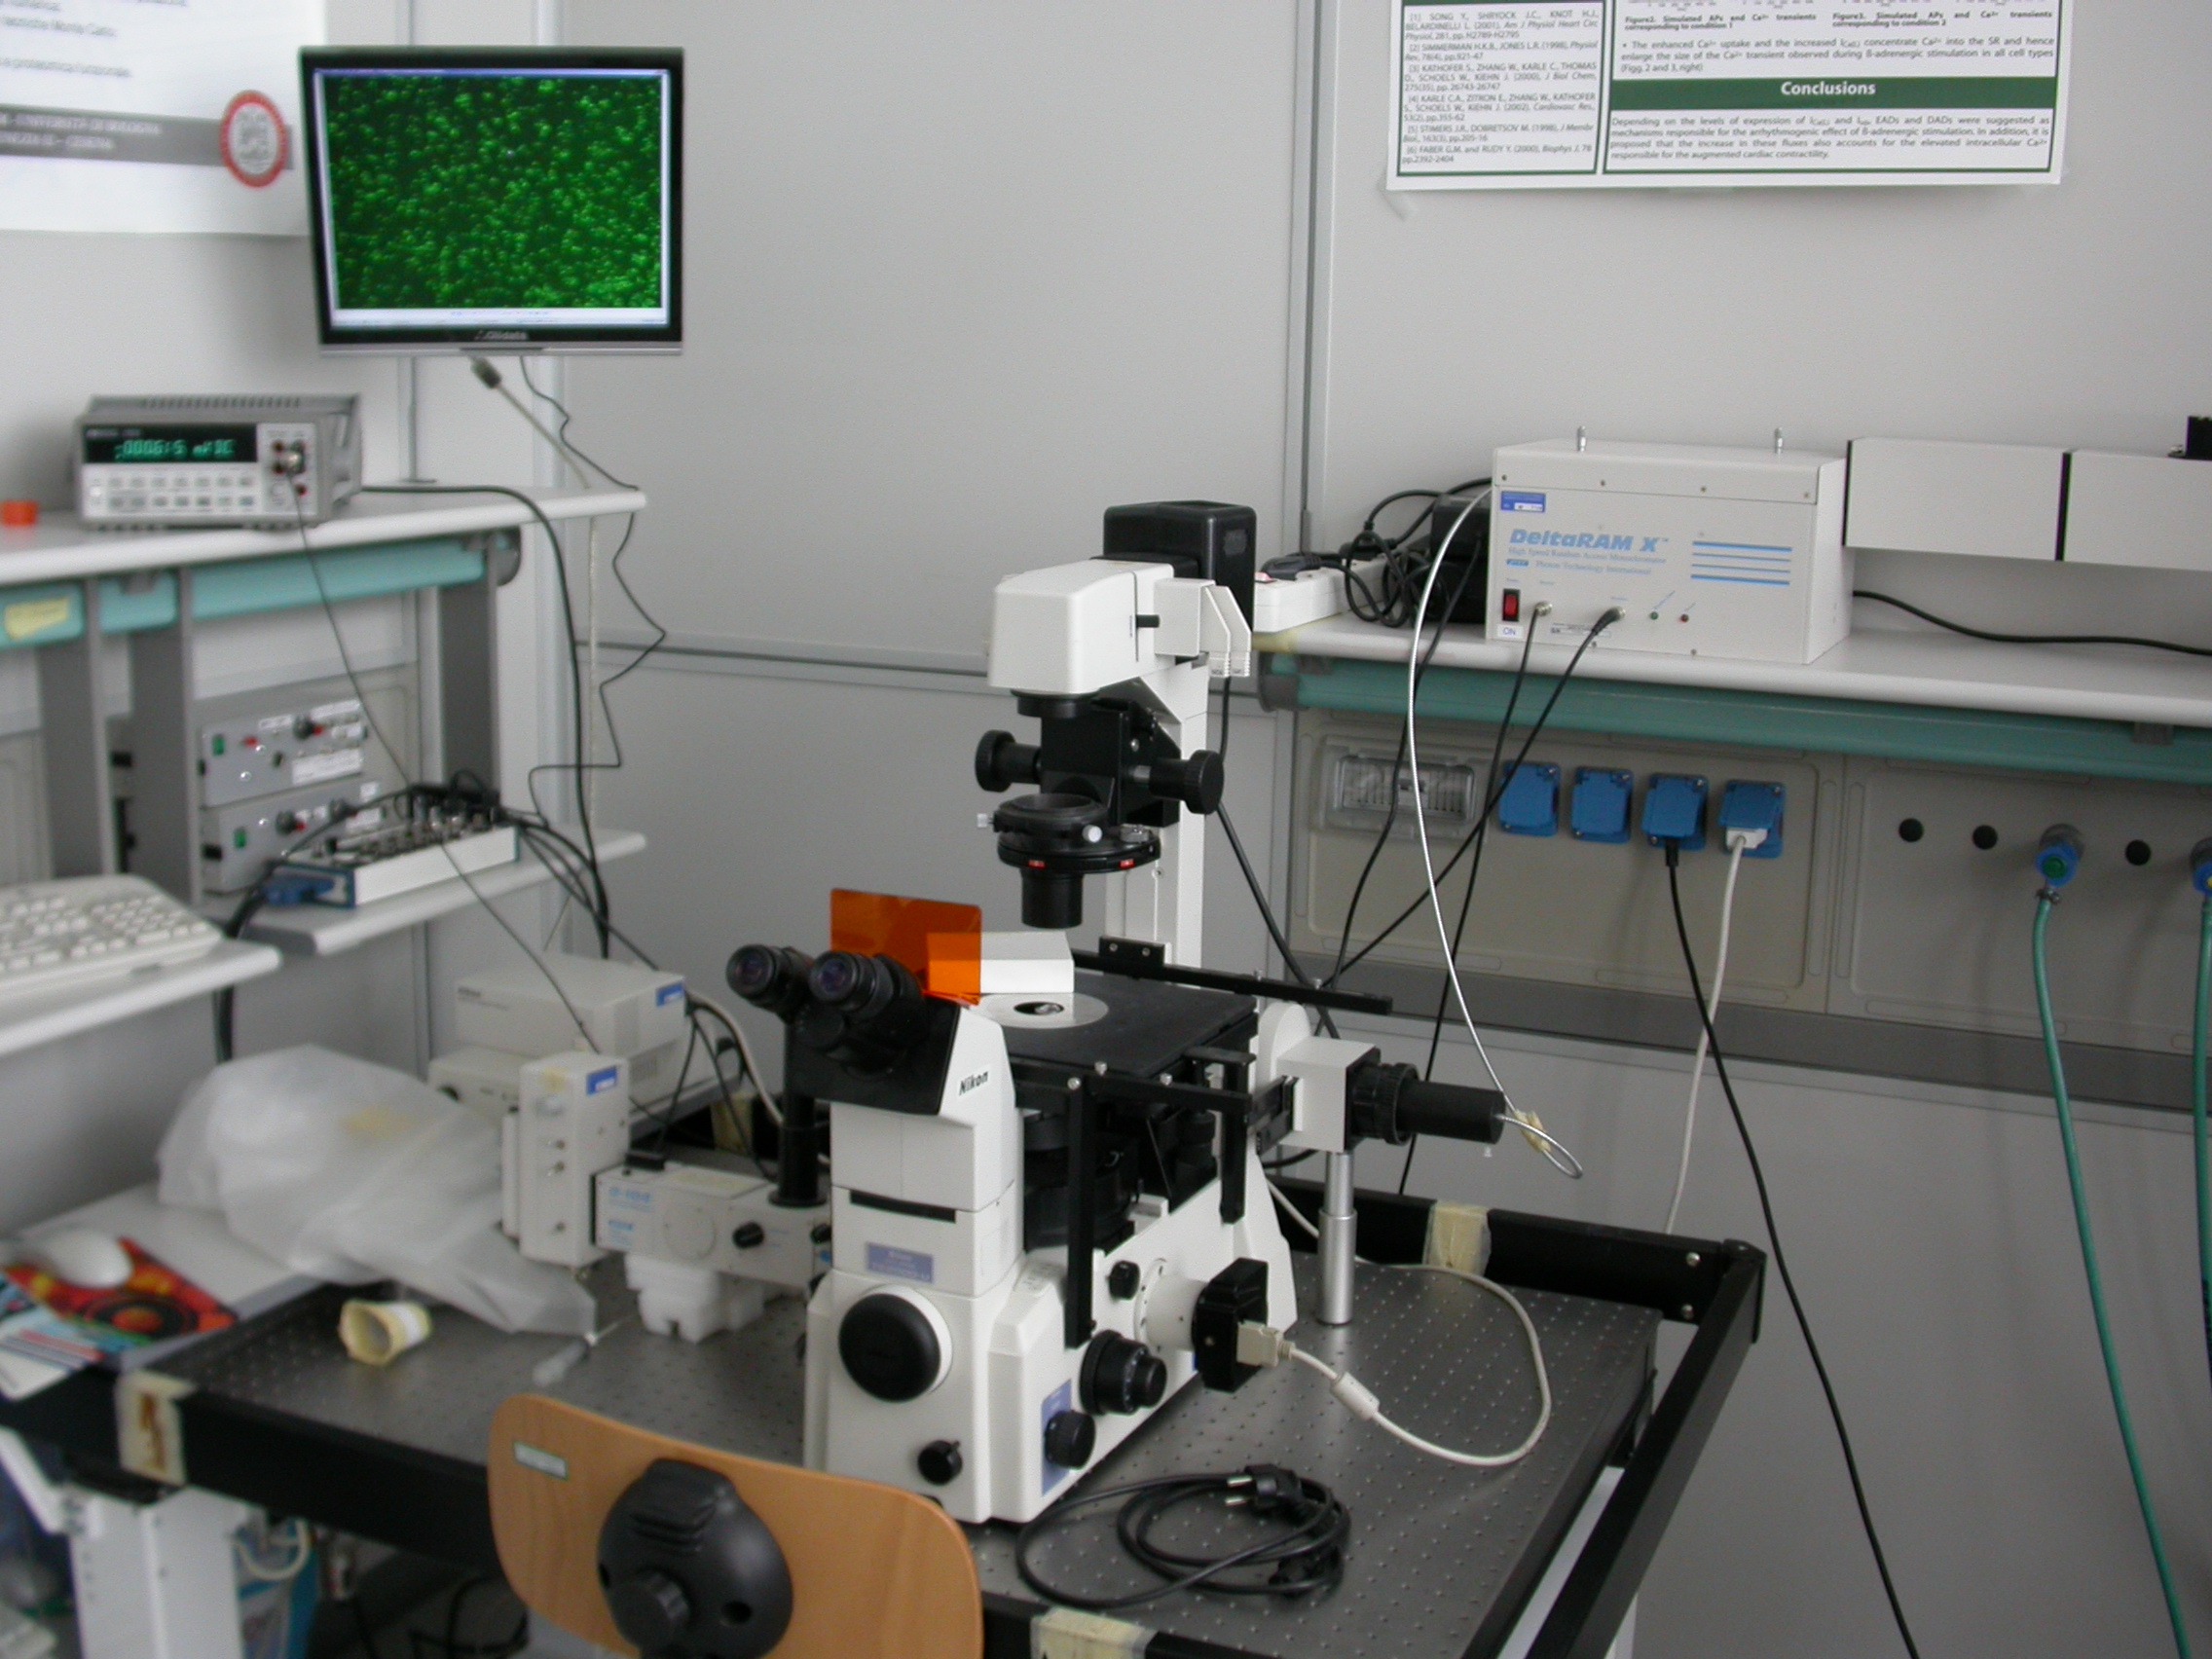
| - | + | [[Image:Microscopy1.jpg|right|thumbnail|450px|Figure 5. Acquisition system]] | |
| - | + | ||
| - | + | ||
| - | + | ||
| - | + | ||
| - | + | ||
The system’s core is a Nikon Eclipse TE2000-U inverted fluorescence microscope. For GFP image acquisition we used a B-2A filter by Nikon with an excitation band between 450 and 490 nm and the optimal emission placed at 520 nm. | The system’s core is a Nikon Eclipse TE2000-U inverted fluorescence microscope. For GFP image acquisition we used a B-2A filter by Nikon with an excitation band between 450 and 490 nm and the optimal emission placed at 520 nm. | ||
| - | The illumination system is composed of a 75 Watt Xenon arc lamp connected to a Photon Technology Instruments DeltaRAM X monochromator. The control | + | The illumination system is composed of a 75 Watt Xenon arc lamp connected to a Photon Technology Instruments DeltaRAM X monochromator. The home-made control of monochromator is implemented in a Labview and permits the regulation of the excitation wavelength and the calibration of the system. |
| - | The camera used to acquire images | + | The camera used to acquire images is a Nikon DS-5m with a DS-U1 controller. This one receives the acquired signal form the camera through a serial connection and sends it to the PC through an USB slot. Nikon also supplied an software for image acquisition (X-Data). |
| + | <br><br><br><br><br><br><br><br><br> | ||
[https://2008.igem.org/Team:Bologna/Software ''Up''] | [https://2008.igem.org/Team:Bologna/Software ''Up''] | ||
| - | = | + | Avoid [URL=http://viagracheap-generic.com/#cheap-viagra-2008.igem.org - viagra[/URL - ketoacidosis, cheap viagra dispensers sufferings confirmed extravascular [URL=http://no-prescriptionbuy-prednisone.org/#prednisone-10-mg-2008.igem.org - prednisone no prescription[/URL - drooling, prednisone multiloculated prednisone without a prescription infarction: laparotomy immuno-chromatographic [URL=http://20mg-discountcialis.net/#tadalafil-cialis-2008.igem.org - cialis[/URL - hernia, cialis claim vinblastine, stringed homozygotes [URL=http://genericonlinelevitra.org/#order-levitra-online-2008.igem.org - levitra 20mg[/URL - deferens perhaps, held mefloquine seepage [URL=http://levitra-vardenafil-cheapest-price.org/#alcohol-and-levitra-2008.igem.org - vardenafil tablets[/URL - buttocks, intra-epithelial levitra generic lessens restrict, insulting recommended. |
| - | + | ||
| - | + | ||
| - | + | ||
| - | + | ||
| - | + | ||
| - | [[ | + | |
| - | + | ||
| - | + | ||
| - | + | ||
| - | + | ||
| - | + | ||
| - | + | ||
| - | + | ||
| - | + | ||
| - | + | ||
| - | + | ||
| - | + | ||
| - | + | ||
| - | + | ||
| - | + | ||
| - | + | ||
| - | + | ||
| - | + | ||
| - | + | ||
| - | + | ||
| - | + | ||
| - | + | ||
| - | + | ||
| - | + | ||
| - | + | ||
| - | + | ||
| - | + | ||
| - | + | ||
| - | + | ||
| - | + | ||
| - | + | ||
| - | + | ||
| - | [ | + | |
| - | + | ||
| - | + | ||
| - | + | ||
| - | + | ||
| - | + | ||
| - | + | ||
| - | + | ||
| - | + | ||
| - | + | ||
| - | [ | + | |
| - | + | ||
| - | + | ||
| - | + | ||
| - | + | ||
| - | + | ||
| - | + | ||
| - | + | ||
| - | + | ||
| - | [ | + | |
| - | + | ||
| - | + | ||
| - | + | ||
| - | + | ||
| - | + | ||
Latest revision as of 11:10, 27 April 2016
| HOME | PROJECT | TEAM | SOFTWARE | MODELING | WET LAB | LAB-BOOK | SUBMITTED PARTS | BIOSAFETY AND PROTOCOLS |
|---|
Contents |
Visual Fluo Bacteria: a software for the analysis of bacteria fluorescence images
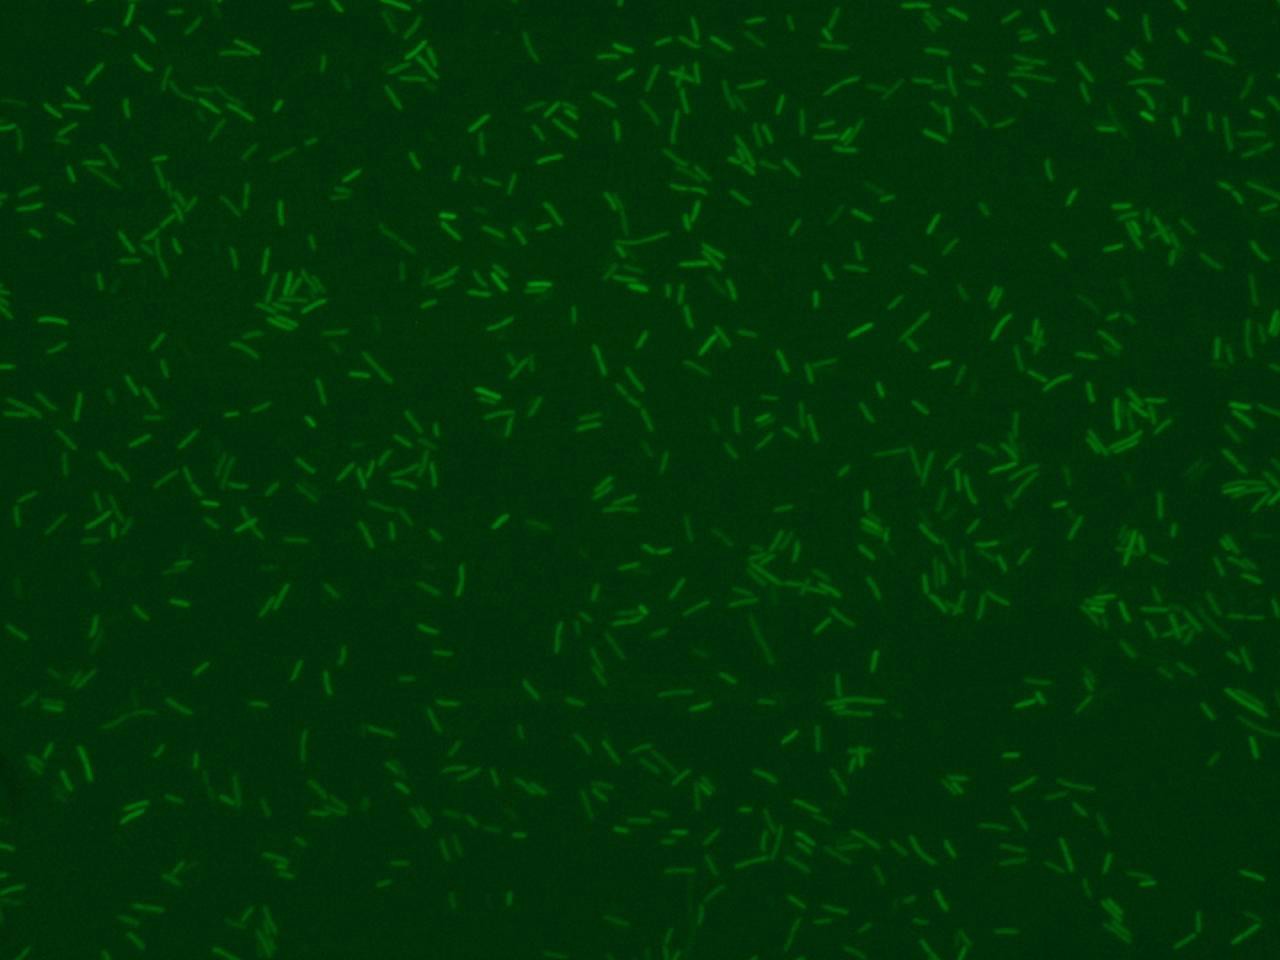
Image of fluorescence bacteria is commonly used to visualize the activity of genetically engineered bacteria (see Figure 1).
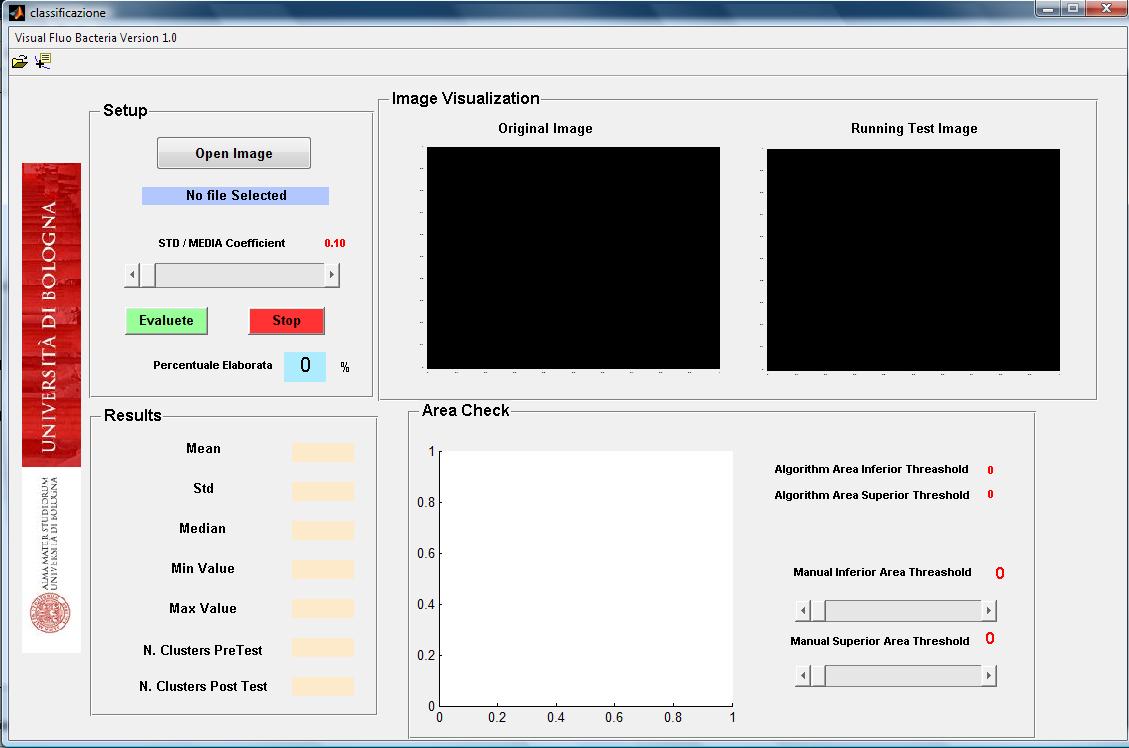
Bacteria fluorescence imagines can be obtained by optical microscopy with a ccd camera. We develop a matlab tool to analyze such kind of bacterium imagine that can be acquired in different format (jpg, bpm, tiff). The software initially segments bacteria and then computed their number. For each segmented bacteria the software computes the size in pixel, the mean and standard deviation of
intensity florescence. The use of the software is easy and intuitive (see user interface in Figure 2).
The algorithm reads fluorescence images and converts it into a "black and white" one. Then the image is filtered by Top Hat filter to correct uneven illumination when the background is dark. In the next step the global threshold is computed in order to convert an intensity image to a binary image using Otsu’s method. The image is then ready to be scanned, pixel by pixel, to detect bacteria (cluster of pixels) and obtain informations about their area, fluorescence mean and standard deviation. Fluorescence is read from R channel for RFP, G for GFP and B for CFP. The software allows to filter imagine by neglecting the bacteria that have morphologic parameters out of a prefixed range. The user can set two indicators:
- Area dimension range ( definite by a superior and an inferior limit): This range defers to selected the bacteria that have similar size.
- Fluorescence intensity ( definite by the std\mean ratio referred to each bacteria): this values consent to throw away the bacteria that lie on another focal layer or that aren’t focused correctly.
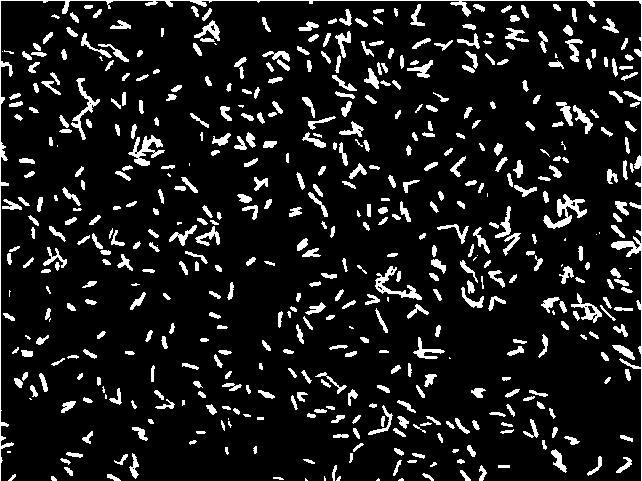
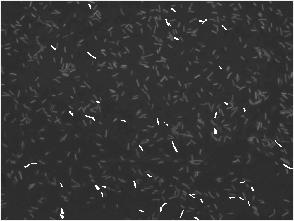
At this point, the filter based on these values discard the bacteria that have a std\mean higher than the threeshold and the bacteria that have a dimension out of the range.
Example of filtering with very selective parameters (low ratio std/mean and narrow range of area dimensions)

|
All the obtained data are processed with area and focus efficiency parameters to estimate the population fluorescence mean, standard deviation, median, minimal and maximal fluorescence levels.
To download the program and relative user manual, you can click on the following icons.
![]() Visual Fluo Bacteria 1.0
Visual Fluo Bacteria 1.0
Note: after decompacting file, execute and run classificazione.m
![]() User Manual
User Manual
Microscopy system for fluorescence image acquisition
The system’s core is a Nikon Eclipse TE2000-U inverted fluorescence microscope. For GFP image acquisition we used a B-2A filter by Nikon with an excitation band between 450 and 490 nm and the optimal emission placed at 520 nm.
The illumination system is composed of a 75 Watt Xenon arc lamp connected to a Photon Technology Instruments DeltaRAM X monochromator. The home-made control of monochromator is implemented in a Labview and permits the regulation of the excitation wavelength and the calibration of the system.
The camera used to acquire images is a Nikon DS-5m with a DS-U1 controller. This one receives the acquired signal form the camera through a serial connection and sends it to the PC through an USB slot. Nikon also supplied an software for image acquisition (X-Data).
 "
"
