Team:Bologna/Modeling
From 2008.igem.org
(→Operator site library standardization) |
(→Numerical simulation) |
||
| Line 194: | Line 194: | ||
== Numerical simulation== | == Numerical simulation== | ||
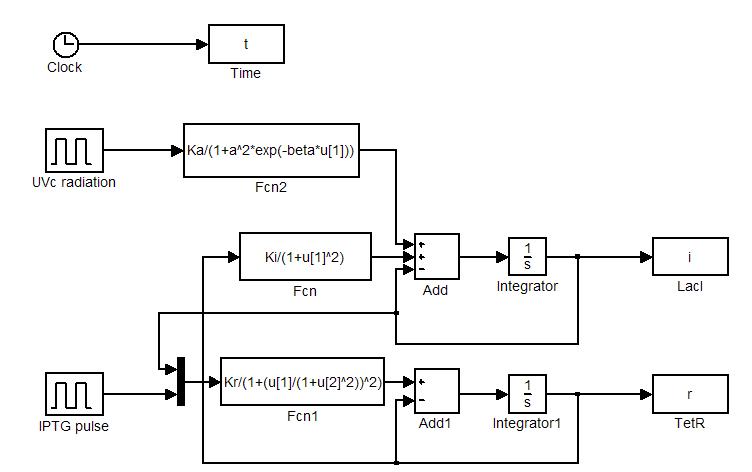
| - | [[Image:sim.jpg|center|500 px|thumbnail|Figure | + | Model equations (1.4) and (1.5) have been used to simulate: i) the sensitivity of the circuit to initial state and ii) the response to IPTG and UV stimulations. Numerical simulations were performed in Simulink (MathWorks). Simulator scheme is shown in Figure 7. To ensure circuit bistability parameters Ki and Kr were both fixed to 10. |
| - | [[Image:iptg4.jpg|center|500 px|thumbnail|Figure | + | [[Image:blocchi.jpg|center|500 px|thumbnail|Fifure 7:]] |
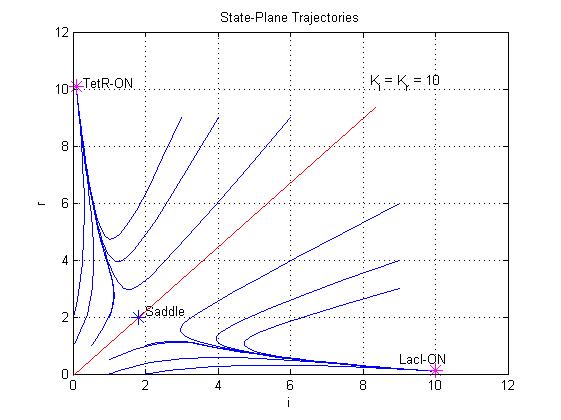
| - | [[Image:UVc1.jpg|center|500 px|thumbnail|Figure | + | The trajectories in the plan of the states (see Figure 8) clearly show two attraction basins (one for the LacI-On and the other for TetR-On equilibrium) and the separatrix line (red line). Depending on the initial state the memory can reach one of two stable equilibria (blu curve). The memory switches from a stable equilibrium to the other one when an external perturbation move the state over the separatrix entering it in the other attraction basin. |
| + | [[Image:sim.jpg|center|500 px|thumbnail|Figure 8: State-Plane Trajectories]] | ||
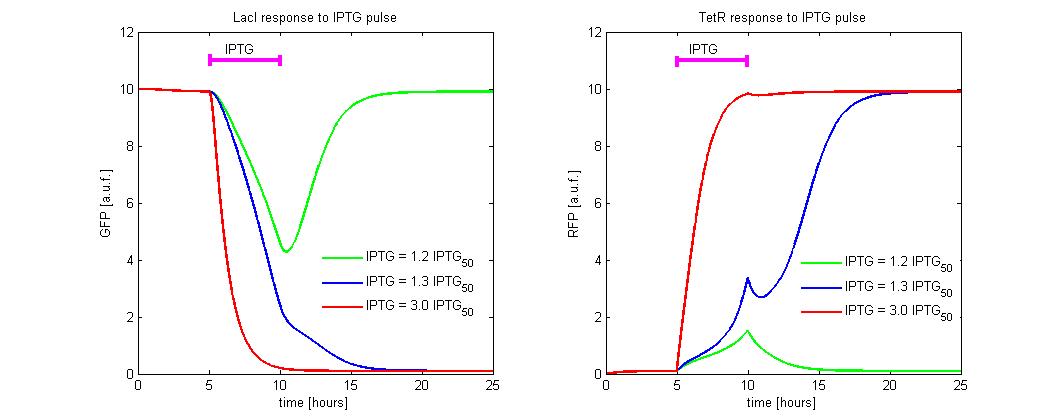
| + | To simulate the IPTG reset, we fixed the initial state to the LACI-ON (i = 10 and r=0.2) and we simulate the application of different levels of IPTG. In the simulation we referred the IPTG to the IPTG50 concentration. An induction of maximum 5 hours was considered (see Figure 9). Until IPTG level is lower than 1.2 times the IPTG50, the memory reset to TetR-ON does not occurred and when the induction finish, the state returns in about 5 hours to LACI-ON. To observe memory switching is necessary to overcome the separatrix. This occurs for IPTG> 1.2 times IPTG50. With minimal IPTG dose the switching is very slow (about 5 hour). To accelerate the transition it is sufficient to expose the circuit for 1 hour to IPTG= 3 times IPTG50. | ||
| + | [[Image:iptg4.jpg|center|500 px|thumbnail|Figure 9: Circuit response to IPTG pulse]] | ||
| + | To simulate the UV set to ON of the memory, we assumed the TetR-ON as initial condition (i=0.2 and r=10), Ka parameter was fixed equal to 10, the a parameter was equal to 30 and 1/β was equal to 2 Joule. We supposed to radiate the memory for few minutes with different UVc energies. The cell radiation starts the SOS response that we simple modeled as a temporary RecA-mediated inhibition of LexA repressor. The memory set to ON does not take place until the UV energy is lower than a threshold of 16 Joule (see Figure 10). When the UV exceeds this threshold, the memory switches from TetR-ON to LacI-ON. | ||
| + | [[Image:UVc1.jpg|center|500 px|thumbnail|Figure 10: Circuit response to UVc radiation]] | ||
Revision as of 14:08, 29 October 2008
| HOME | PROJECT | TEAM | SOFTWARE | MODELING | WET LAB | LAB-BOOK | SUBMITTED PARTS | BIOSAFETY AND PROTOCOLS |
|---|
Contents |
Model-based analysis of the genetic Flip-Flop
The genetic Flip-Flop
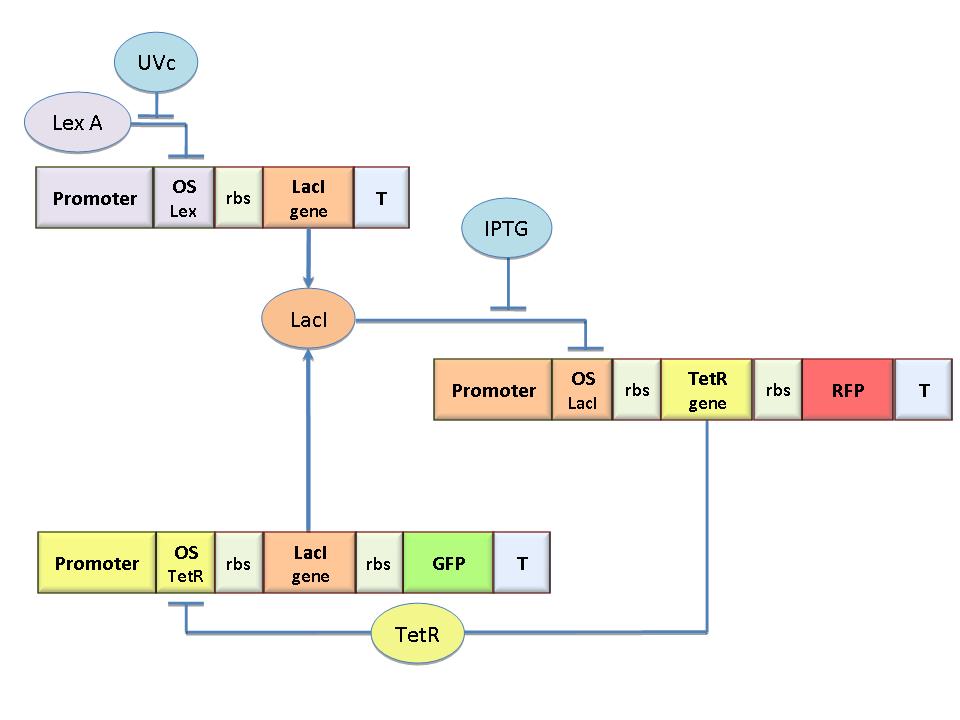
The molecular circuit in Figure 1 can switch between two different stable states (LacI-ON and TetR-ON), driven by two external stimuli (UVc and IPTG). LacI-ON represents the stable state where the LacI gene is active and LacI protein represses TetR gene expression, in a positive feedback. Therefore, the LacI-ON state coincides with the TetR-OFF condition. On the contrary, the TetR-ON represents the state with the TetR gene active and the LacI gene silenced (LacI-OFF). Owing to the coexistence of two stable states (bistability), this circuit is capable of serving as a binary of memory. We denominated it a Flip-Flop since it works as a SR Latch: LacI state is the ![]() output and TetR state is the
output and TetR state is the ![]() output. Uvc is the set signal and IPTG is the reset signal. Indeed, IPTG stimulation inhibits LacI repressor, thus can cause the transition from the LacI-ON state to the TetR-ON. UVc radiation, inactivating LexA repressor through the SOS response (Friedberg et al., 1995) can cause the opposite transition from LacI-ON to TetR-ON.
output. Uvc is the set signal and IPTG is the reset signal. Indeed, IPTG stimulation inhibits LacI repressor, thus can cause the transition from the LacI-ON state to the TetR-ON. UVc radiation, inactivating LexA repressor through the SOS response (Friedberg et al., 1995) can cause the opposite transition from LacI-ON to TetR-ON.
Mathematical Model
Model equations
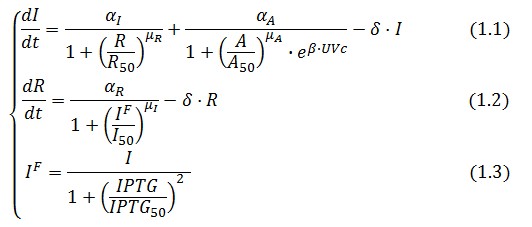
The Flip-Flop circuit in Figure 1 can be modeled by the following equations:
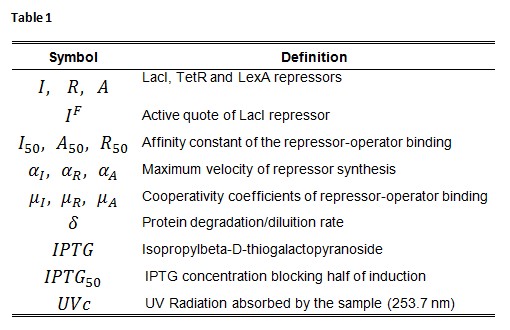
Symbol definition is listed in Table 1.
A common motif in repressor proteins is the presence of a dimeric nucleotide-binding site with dimeric structure. In accordance to this general structure the cooperativity coefficients (![]() ) were assumed equal to 2. The maximum velocity of repressor synthesis (
) were assumed equal to 2. The maximum velocity of repressor synthesis (![]() ) accounts for the strength of the unregulated promoter and RBS. The value of the affinity constant for the binding of repressor to the promoter strictly depends on the sequence of operator site (OS block).
) accounts for the strength of the unregulated promoter and RBS. The value of the affinity constant for the binding of repressor to the promoter strictly depends on the sequence of operator site (OS block).
Adimensional equations
The equations (1.1) and (1.2) can be written dimensionless:
Where:
Equibrium conditions
In the absence of stimuli, the adimensional concentrations of LacI (![]() ) and TetR (
) and TetR (![]() ) at equilibrium are related by the equations:
) at equilibrium are related by the equations:
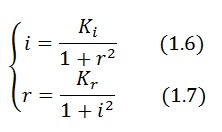
To obtain these relations the UVc-dependent term in equation (1.4) was ignored ( ). This is justified by the high binding constant of LexA for its operator, and the consequent negligible contribution to the LacI synthesis.
Equations (1.6) and (1.7) can have one or three solutions that represent the equilibrium conditions of the circuit. The solutions, i.e. the equilibrium conditions, can be graphically identified as the intersections between
 ![]() and
and ![]() nullclines (see Figure 2). The case of multiple equilibrium conditions (bistability case) is shown in Figure 2 panel b. TetR-ON and LacI-ON are stable equilibriums separated by the unstable one (saddle point). Due to the bistability the circuit can operate as a binary memory.
The existence of a bistability condition depends on the value of
nullclines (see Figure 2). The case of multiple equilibrium conditions (bistability case) is shown in Figure 2 panel b. TetR-ON and LacI-ON are stable equilibriums separated by the unstable one (saddle point). Due to the bistability the circuit can operate as a binary memory.
The existence of a bistability condition depends on the value of ![]() and
and ![]() parameters. If
parameters. If ![]() decrease (see Figure 2 panel a) a saddle-node bifurcation can occur, TetR-ON equilibrium vanishes and remain only the stable equilibrium LacI-ON. The contrary occurs when
decrease (see Figure 2 panel a) a saddle-node bifurcation can occur, TetR-ON equilibrium vanishes and remain only the stable equilibrium LacI-ON. The contrary occurs when ![]() is decreased (Figure 2 panel c). Thus bistability is guaranteed only for a limited range of
is decreased (Figure 2 panel c). Thus bistability is guaranteed only for a limited range of ![]() and
and ![]() values.
values.
Bifurcation analysis
Assuming that LacI-ON exists the corresponding equilibrium value of ![]() is higher than 1 (see Figure 2), then it can be assumed that
is higher than 1 (see Figure 2), then it can be assumed that ![]() and the equation (1.7) simplies to:
and the equation (1.7) simplies to:
Substituting this expression in equation (1.6) one obtain:
Then:
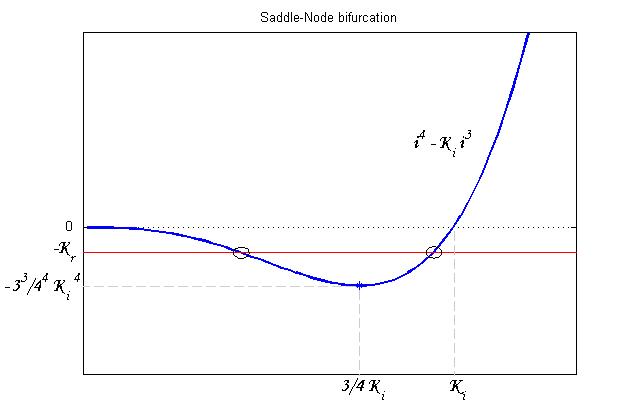
To be real the solutions of equation (1.10) it is necessary that  (see Figure 3). Under this condition the existence of the LacI-ON state is assured. When
 ![]() the system undergoes a saddle-node bifurcation (LacI-ON and saddle point go in collision) and the two equilibrium points vanish.
the system undergoes a saddle-node bifurcation (LacI-ON and saddle point go in collision) and the two equilibrium points vanish.
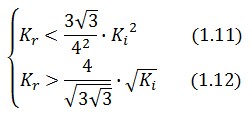
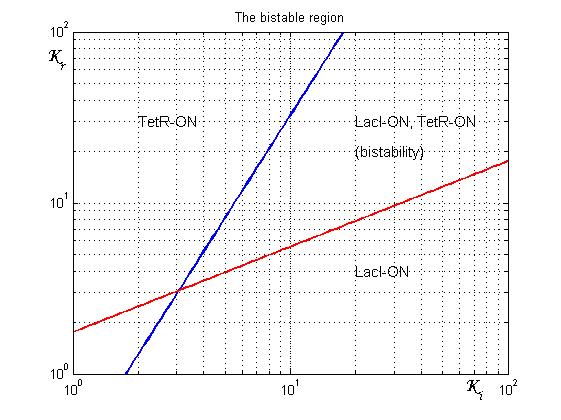
An analogous result can be obtained for the existence of the TetR-ON state. Thus, a sufficient condition for bistability is:
Figure 4 shows the log-log plot of (1.11) and (1.12)
Procedure for Ki-index identification
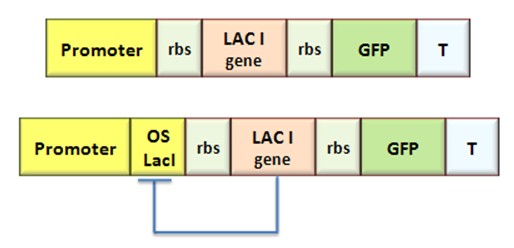
The procedure will be described for LacI, analogous procedure can be applied to the TetR case. The value of ![]() -index can be identified comparing the experimental responses of the open loop and closed loop circuits:
-index can be identified comparing the experimental responses of the open loop and closed loop circuits:
|
|
The LacI concentration in the open loop circuit is given by:
Thus the equilibrium condition is:
The time derivative of LacI concentration in the close loop circuit follows:
Which gives the equilibrium condition:
That can be rewritten
The affinity constant can consequently be derived from this expression
Inserting the (1.14) and (1.18) in the ![]() -index definition one obtain:
-index definition one obtain:
We assume that GFP is proportion to ![]() , then
, then
We introduce the ratio ![]() between the fluorescence in open loop and in closed loop:
between the fluorescence in open loop and in closed loop:
After measuring the ratio ![]() it is possible to calculate
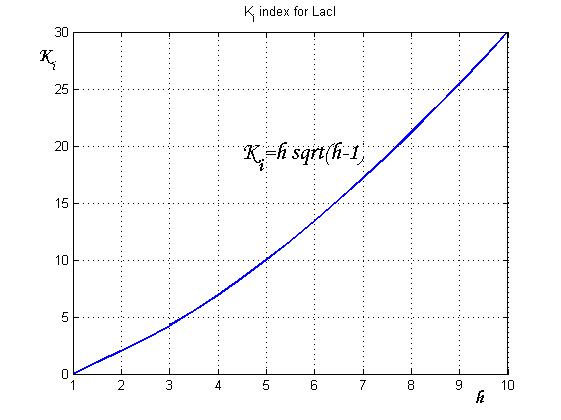
it is possible to calculate ![]() by the curve in Figure 6 and then it is possible to establish by Figure 4 the
by the curve in Figure 6 and then it is possible to establish by Figure 4 the ![]() range that guarantees bistability. In the presence of an experimentally characterized library of regulated promoter, the procedure can be adopted to design genetic Flip-Flop with desired behaviors.
range that guarantees bistability. In the presence of an experimentally characterized library of regulated promoter, the procedure can be adopted to design genetic Flip-Flop with desired behaviors.
Numerical simulation
Model equations (1.4) and (1.5) have been used to simulate: i) the sensitivity of the circuit to initial state and ii) the response to IPTG and UV stimulations. Numerical simulations were performed in Simulink (MathWorks). Simulator scheme is shown in Figure 7. To ensure circuit bistability parameters Ki and Kr were both fixed to 10.
The trajectories in the plan of the states (see Figure 8) clearly show two attraction basins (one for the LacI-On and the other for TetR-On equilibrium) and the separatrix line (red line). Depending on the initial state the memory can reach one of two stable equilibria (blu curve). The memory switches from a stable equilibrium to the other one when an external perturbation move the state over the separatrix entering it in the other attraction basin.
To simulate the IPTG reset, we fixed the initial state to the LACI-ON (i = 10 and r=0.2) and we simulate the application of different levels of IPTG. In the simulation we referred the IPTG to the IPTG50 concentration. An induction of maximum 5 hours was considered (see Figure 9). Until IPTG level is lower than 1.2 times the IPTG50, the memory reset to TetR-ON does not occurred and when the induction finish, the state returns in about 5 hours to LACI-ON. To observe memory switching is necessary to overcome the separatrix. This occurs for IPTG> 1.2 times IPTG50. With minimal IPTG dose the switching is very slow (about 5 hour). To accelerate the transition it is sufficient to expose the circuit for 1 hour to IPTG= 3 times IPTG50.
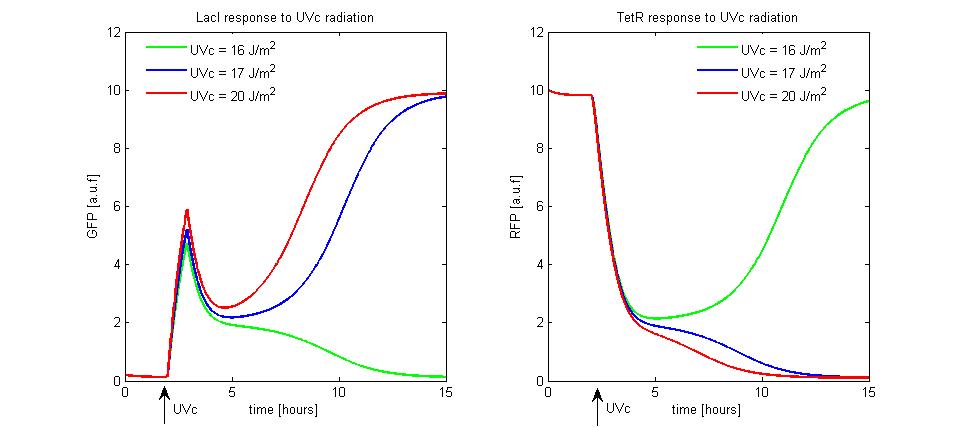
To simulate the UV set to ON of the memory, we assumed the TetR-ON as initial condition (i=0.2 and r=10), Ka parameter was fixed equal to 10, the a parameter was equal to 30 and 1/β was equal to 2 Joule. We supposed to radiate the memory for few minutes with different UVc energies. The cell radiation starts the SOS response that we simple modeled as a temporary RecA-mediated inhibition of LexA repressor. The memory set to ON does not take place until the UV energy is lower than a threshold of 16 Joule (see Figure 10). When the UV exceeds this threshold, the memory switches from TetR-ON to LacI-ON.
SR Latch
In digital circuits, a flip-flop is a term referring to an electronic circuit (a bistable multivibrator) that has two stable states and thereby is capable of serving as one bit of memory. Today, the term flip-flop has come to mostly denote non-transparent (clocked or edge-triggered) devices, while the simpler transparent ones are often referred to as latches; however, as this distinction is quite new, the two words are sometimes used interchangeably.
A flip-flop is usually controlled by one or two control signals and/or a gate or clock signal. The output often includes the complement as well as the normal output. As flip-flops are implemented electronically, they require power and ground connections.
Flip-flops can be either simple (transparent) or clocked. Simple flip-flops can be built around a pair of cross-coupled inverting elements: vacuum tubes, bipolar transistors, field effect transistors, inverters, and inverting logic gates have all been used in practical circuits — perhaps augmented by some gating mechanism (an enable/disable input). The more advanced clocked (or non-transparent) devices are specially designed for synchronous (time-discrete) systems; such devices therefore ignores its inputs except at the transition of a dedicated clock signal (known as clocking, pulsing, or strobing). This causes the flip-flop to either change or retain its output signal based upon the values of the input signals at the transition. Some flip-flops change output on the rising edge of the clock, others on the falling edge.
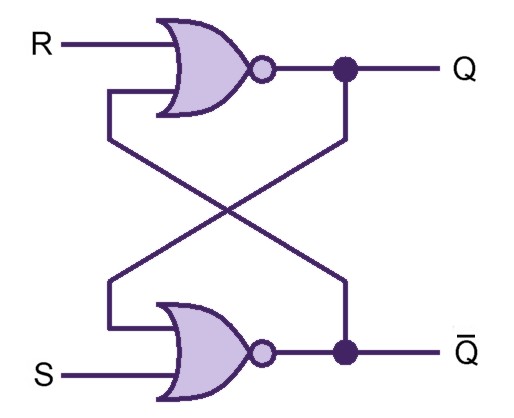
Our project simulates a SR Latch (Figure 10), the most fundamental latch, where S and R stand for set and reset. It can be constructed from a pair of cross-coupled NOR logic gates. The stored bit is present on the output marked Q (or the complement Q).
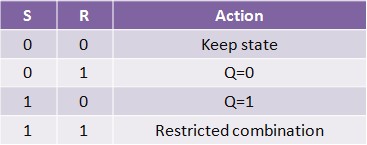
Normally, in storage mode, the S and R inputs are both low, and feedback maintains the Q and Q outputs in a constant state. If S (Set) is pulsed high while R is held low, then the Q output is forced high, and stays high when S returns low; similarly, if R (Reset) is pulsed high while S is held low, then the Q output is forced low, and stays low when R returns low (Figure 11).
The R = S = 1 combination is called a restricted combination because, as both NOR gates then output zeros, it breaks the logical equation Q = not Q. The combination is also inappropriate in circuits where both inputs may go low simultaneously (i.e. a transition from restricted to keep). The output would lock at either 1 or 0 depending on the propagation time relations between the gates (a race condition). In certain implementations, it could also lead to longer ringings (damped oscillations) before the output settles, and thereby result in undetermined values (errors) in high-frequency digital circuits. This condition is therefore sometimes avoided.
Operator site library standardization
Even though transcriptional regulation still plays a pivotal role in synthetic biology, a modular assembly of regulated promoters and characterization of their properties has not been formalized, yet. Even in the Registry, each promoter, though complex, is treated as a “standalone” monolithic element. At present state, the choice of a regulated promoter implies a prefixed sigmoid regulation curve. The only option is to choose a discretional scaling factor in the transfer of the transcription function to the protein through an appropriate RBS. Moreover, the choice of one specific transcription factor limits the choice to one or few possible promoter. The assembly of regulated promoters as the combination of such modular parts, as transcription factor binding sites and operators, could permit the rapid design of devices with desired regulation curves. In fact, in this way, promoter transcriptional strength and repressor binding affinity could be independently fixed.
A first step in the direction of promoting element rationalization has been done the past year with the inclusion in the Registry of a family of [http://partsregistry.org/wiki/index.php?title=Part:BBa_J23101 constitutive promoters]. Each element differs from the other members in the family just for few base pairs in -35 and -10 regions, keeping constant the rest of the sequence and giving rise to a different level of transcription spanning. We decided to use this valuable work as a platform, a starting point for a deeper and more general design strategy.
Thus, we designed an operator sequence library for four commonly used repressor proteins: LacI, TetR, cI and LexA (link figura). For each of these repressors, we got three sequences from the literature (link) with different repressor binding affinities (link Registry), to get a fine modulation of promoter sensitivity to repressor (see Table 1). Then, we isolated each single operator from the library (link al metodo) to assemble it into standard plasmids from the Registry of standard parts.
Once we get single operators or a combination of them, we can decide to assemble them in different position relatevely to promoter -35 and -10 sequences. It is known from the literature (Cox et al) that the position of an operator site, respectevely to the promoter, plays a crucial role in determining repression or activation. Moreover, even different repression levels can depend on the operator position. The three possible "locations" for operator sequences are:
- the distal region - upstream the -35 sequence
- the core region - between the -35 and the -10
- the proximal region- downstream the -10 sequence
Since genomic position affects the operator effect on promoter activation, we decided to take the Berkley's costitutive promoter library as a good "collection" from which we could choose the ideal promoter, depending on the desired transcriptional strengh. Chosen the promoter, we planned to change the operator position to study its effect on the design of specific promoter with a derired behaviour.
UV Spectrum
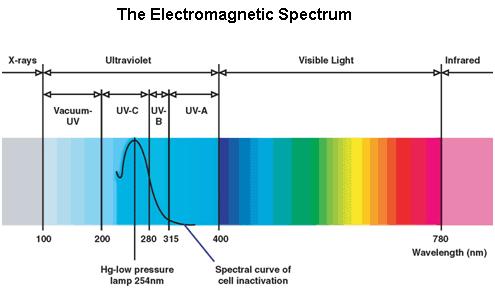
Ultraviolet is that part of electromagnetic radiation bounded by the lower wavelength extreme of the visible spectrum and the upper end of the X-ray radiation band. The spectral range of ultraviolet radiation is, by definition, between 100 and 400 nm and is invisible to human eyes. The UV spectrum is subdivided into three bands: UV-A (long-wave) from 315 to 400 nm, UV-B (medium-wave) from 280 to 315 nm, UV-C (short-wave) from 100 to 280 nm. A strong germicidal effect is provided by the radiation in the short-wave UV-C band.
E.coli SOS System
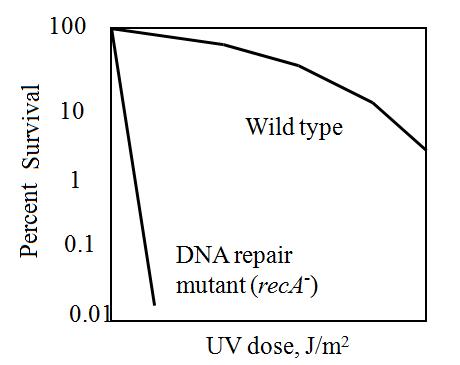
The maximum UV germicidal effect coincides with the peak absorbance of DNA (near 260nm) due to the dimerization of two adjacent thymines. That can be seen in the Fig.1 where is showed the living population of bacteria after irradiation.
E.Coli cells have a system that recovery DNA damage when it occurs and it is the best studied transcriptional response [1].
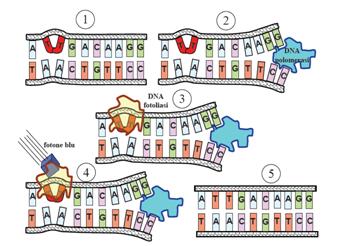
This systems can be divided into two class: the SOS Photoreactivation repair and the SOS respond triggered by RecA protein. The first uses the photolyase, a poorly expressed enzyme(encoded by genes phrA and phrB) which binds the pyrimidine dimers and uses the blue light to split them apart as showed in Fig.2.
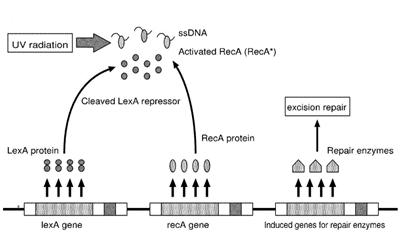
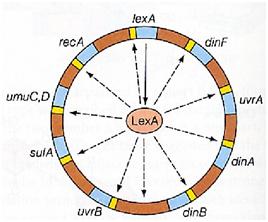
Instead single stranded DNA produced by several DNA-damaging agents can be bound by RecA protein, resulting in conversion of this protein to its activated form. The RecA repair system doesn’t need light and Lexa protein controls the expression of 43 genes [2] that cooperate together to repair the extensive genetic damage. RecA and LexA proteins play an important rule on the regulatory of SOS Recombination System.
A LexA binding site is present in all the SOS promoters genes' and it works as a repressor of SOS system. In presence of DNA damage (DNA Single Strains) RecA becomes active and interacts with LexA protein , the repressor of the SOS genes [3]. This interaction triggers the autocatalytic cleavage of LexA and consequent destruction of its ability to function as a repressor, which results in the derepression of SOS genes [4] [5]
When the damage is repaired, DNA single strains are not present in the cell and the RecA protein no longer promotes the auto-cleavage of the LexA which is restored to its initial repression level.
| 
|
 "
"


