Team:KULeuven/Model/Reset
From 2008.igem.org
(→Matlab) |
(→Models) |
||
| Line 212: | Line 212: | ||
==== CellDesigner ([https://static.igem.org/mediawiki/2008/0/02/LactonaseProduction_CellDesigner.zip SBML file]) ==== | ==== CellDesigner ([https://static.igem.org/mediawiki/2008/0/02/LactonaseProduction_CellDesigner.zip SBML file]) ==== | ||
| - | + | ||
[[Image:LactonaseProduction_CellDesigner.png|500px|center]] | [[Image:LactonaseProduction_CellDesigner.png|500px|center]] | ||
| - | |||
| - | |||
| - | |||
| - | |||
==== Matlab ([https://static.igem.org/mediawiki/2008/8/8d/LactonaseProduction_Matlab.zip SBML file]) ==== | ==== Matlab ([https://static.igem.org/mediawiki/2008/8/8d/LactonaseProduction_Matlab.zip SBML file]) ==== | ||
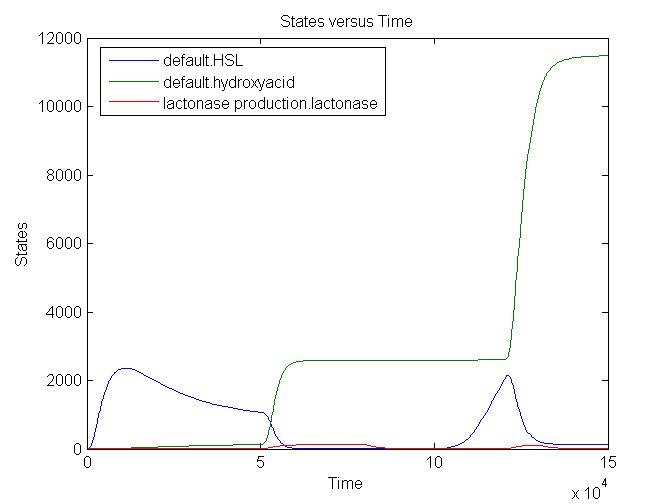
[[Image:LactonaseProduction_Matlab.jpg|500px|center]] | [[Image:LactonaseProduction_Matlab.jpg|500px|center]] | ||
| + | |||
| + | |||
| + | |||
| + | === Simulation === | ||
| + | |||
| + | The number lactonase genes is held constant during the entire simulation. For the first 15.000 seconds the number of mRNA Ribokey is equal to 0.015 and the number of pT7 molecules to 0.4, then for 15000 s these numbers are set on 6 and 3 respectively (based on the results of the model of the filter) after which they are reduced back to 0.015 and 0.4. <br> | ||
| + | We see that an increase in the number of mRNA Ribokey and pT7(due to an increase in light intensity) will lead to a much higher number of lactonase molecules. | ||
| + | [[Image:Sim_lactonaseproduction_1.png|700px|center]] | ||
Revision as of 10:37, 14 August 2008
Contents |
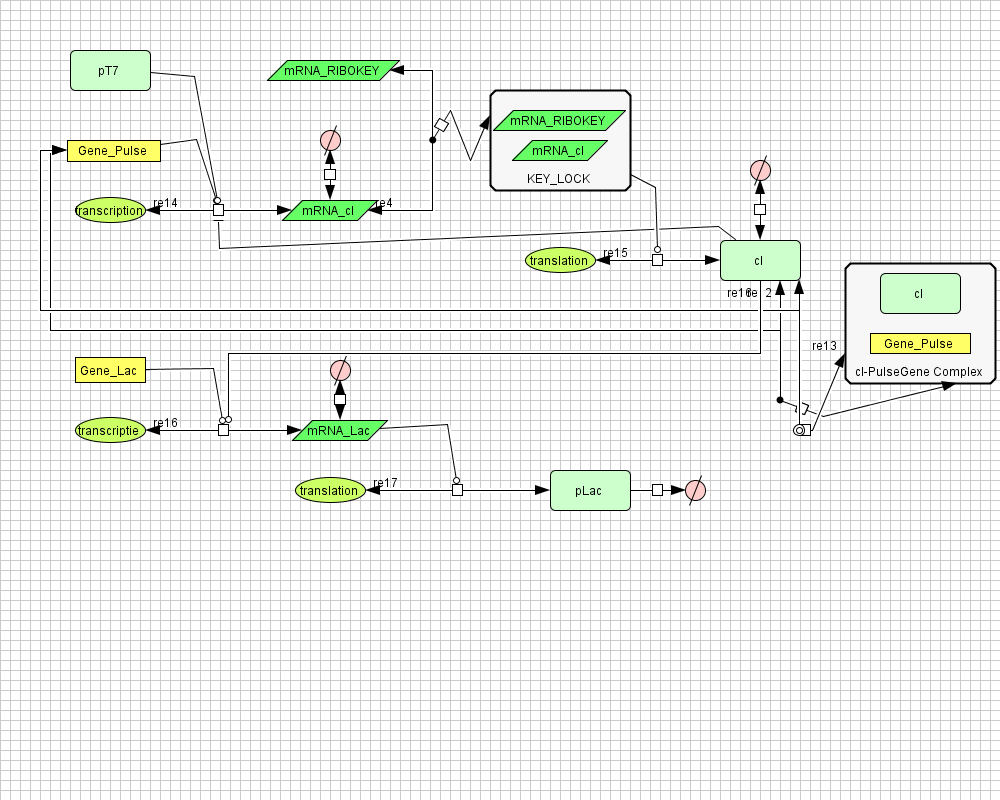
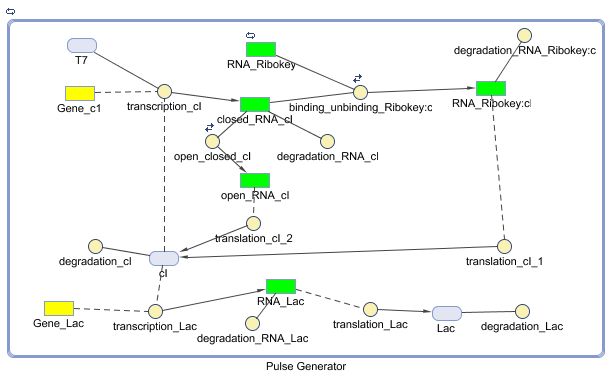
Pulse Generator
Position in the system
Describing the system
ODE's
Parameters
| Name | Value | Comments | Reference |
|---|---|---|---|
| Degradation rates | |||
| dRNA_cI | 0.00462 s-1 | ||
| dcI | 7.0E-4 s-1 | [http://parts.mit.edu/igem07/index.php?title=ETHZ/Parameters link] | |
| dRNA_Lac | 0.00231 s-1 | ||
| dLac | 2.888E-4 s-1 | ||
| dRNA_Ribokey:cI | 0.00231 s-1 | ||
| Dissociation constants | |||
| KRibokey:cI | 0.00212 | kass/kdiss for the Ribokey cI complex | |
| KcI | 0.00337 | binding cI on cI-Promotor | [http://parts.mit.edu/igem07/index.php?title=ETHZ/Parameters link] |
| Transcription rates | |||
| kRNA_cI | 0.025 s-1 | maximal transcription rate RNA cI (no cI repressor present) | |
| kRNA_Lac | 0.025 s-1 | ||
| Translation rates | |||
| kcI | 0.167 s-1 | ||
| kLac | 0.167 s-1 | RBS is B0032 (efficiency 0.3) | [http://partsregistry.org/Part:BBa_B0032 link] |
| Hill cooperativity | |||
| ncI | 2.0 | [http://parts.mit.edu/igem07/index.php?title=ETHZ/Parameters link] | |
Models
CellDesigner (SBML file)
Matlab
Constant Lactonase Production
Position in the system
The Constant Lactonase Production-system is directly linked to the Filter.
When the filter indicates that the input is zero (there is no light), the system will (ideally) produce no lactonase. As soon as the output of the filter is one, the system starts producing lactonase and remains doing this untill the light goes off again.
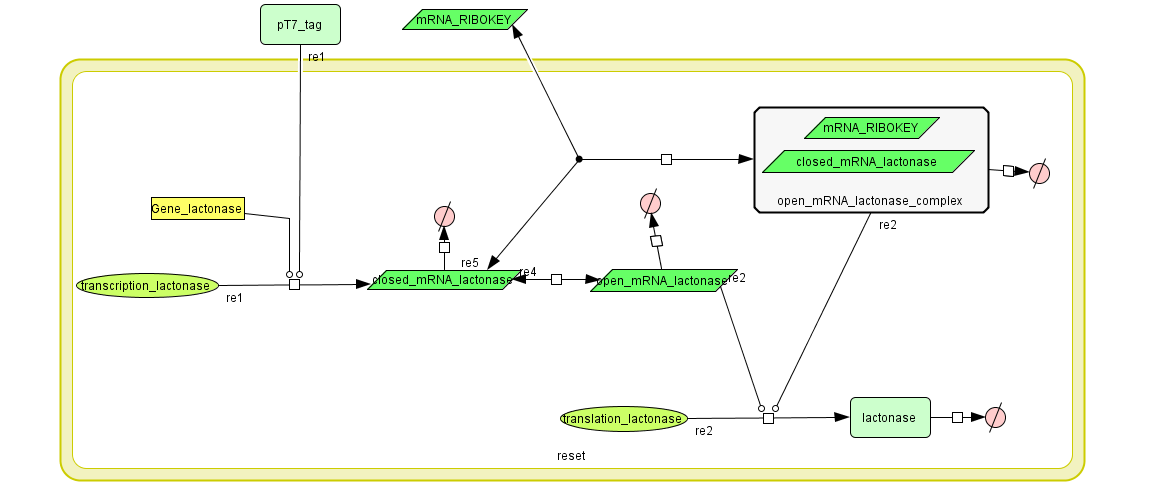
Describing the system
ODE's
Parameters
| Name | Value | Comments | Reference |
|---|---|---|---|
| Degradation Constants | |||
| dlactonase | 2.888E-4 s-1 | ||
| dclosed_mRNA_lactonase | 0.0046209812 s-1 | [http://www.pubmedcentral.nih.gov/picrender.fcgi?artid=124983&blobtype=pdf link] | |
| dopen_mRNA_lactonase | 0.0023104906 s-1 | [http://www.pubmedcentral.nih.gov/picrender.fcgi?artid=124983&blobtype=pdf link] | |
| dopen_mRNA_lactonase_complex | 0.0023104906 s-1 | [http://www.pubmedcentral.nih.gov/picrender.fcgi?artid=124983&blobtype=pdf link] | |
| Transcription Rates | |||
| kmRNA_lactonase | 0.03 s-1 | ||
| Translation Rates | |||
| klactonase | 0.1666667 s-1 | RBS is B0032 (efficiency of 0.3) | |
| Equilibrium constants | |||
| Keq_1 | 0.015 | closed and open mRNA | |
| Keq_2 | 0.0212 M | closed and key (binded with ribokey) complex mRNA | |
| Association/Dissociation/Reaction Rates | |||
| kass (closed mRNA lactonase + mRNA Ribokey) | 2.12 s-1 | ||
| kdiss (closed mRNA lactonase + mRNA Ribokey) | 100 s-1 | ||
| k (open mRNA lactonase) | 1.5 s-1 | ||
| k (closed mRNA lactonase) | 100 s-1 | ||
Models
CellDesigner (SBML file)
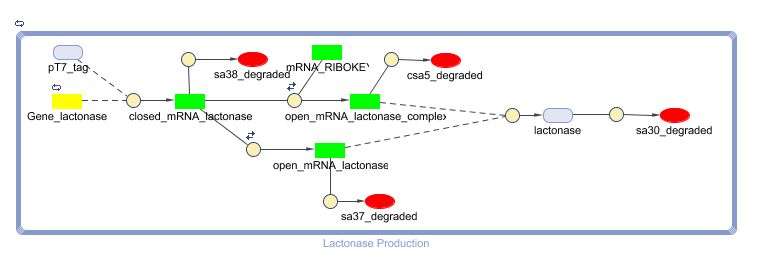
Matlab (SBML file)
Simulation
The number lactonase genes is held constant during the entire simulation. For the first 15.000 seconds the number of mRNA Ribokey is equal to 0.015 and the number of pT7 molecules to 0.4, then for 15000 s these numbers are set on 6 and 3 respectively (based on the results of the model of the filter) after which they are reduced back to 0.015 and 0.4.
We see that an increase in the number of mRNA Ribokey and pT7(due to an increase in light intensity) will lead to a much higher number of lactonase molecules.
 "
"


