Team:Freiburg Calcium Imaging
From 2008.igem.org
(Difference between revisions)
WeberSimone (Talk | contribs) |
|||
| Line 15: | Line 15: | ||
One problem was to find a medium in which the T-cells survive, the | One problem was to find a medium in which the T-cells survive, the | ||
DNA-Origami structures are stable and which is also suitable for the | DNA-Origami structures are stable and which is also suitable for the | ||
| - | fluorescent measurement on the | + | fluorescent measurement on the microsope). Normally, the cells were kept |
in RPMI (10% FCS), but the phenol red itself is an electron acceptor | in RPMI (10% FCS), but the phenol red itself is an electron acceptor | ||
and would disturb the measurement. Another complication was, that the | and would disturb the measurement. Another complication was, that the | ||
| - | Origami need a high Mg2+ concentration (12 | + | Origami need a high Mg2+ concentration (12.5 mM), which stabilizes the |
DNA backbone, but low concentration of other bivalent cations, which | DNA backbone, but low concentration of other bivalent cations, which | ||
could disrupt the Origami. None of the common cell culture medium does | could disrupt the Origami. None of the common cell culture medium does | ||
| Line 24: | Line 24: | ||
the stability of the Origami in different media were tested (see | the stability of the Origami in different media were tested (see | ||
DNA-Origami). On the other hand we also had to test if our cells | DNA-Origami). On the other hand we also had to test if our cells | ||
| - | survive 12 | + | survive 12.5 mM Mg2+, which we tested with an MTT-Assay. <br> |
As explained before, we also wanted to use the Origami to activate | As explained before, we also wanted to use the Origami to activate | ||
T-cell receptors (TCR) by clustering. For this experiment we measured | T-cell receptors (TCR) by clustering. For this experiment we measured | ||
| Line 38: | Line 38: | ||
coated µ-Slides(ibidi). <br> | coated µ-Slides(ibidi). <br> | ||
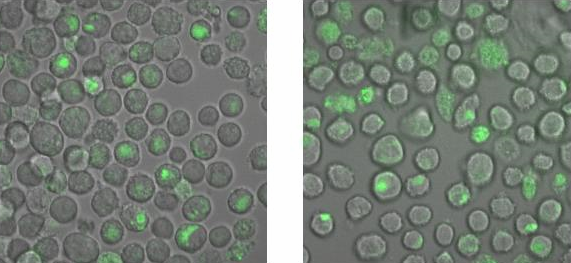
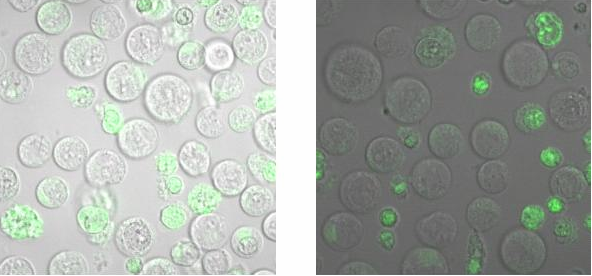
To check, that the DNA-Origami really bind specifically to the | To check, that the DNA-Origami really bind specifically to the | ||
| - | cells(T-cells and B-cells), Alexa 488 linked | + | cells(T-cells and B-cells), Alexa 488 linked Origamis with and without |
NIP were given to the cells and the fluorescence was visualized with a | NIP were given to the cells and the fluorescence was visualized with a | ||
LSM.<br> | LSM.<br> | ||
| Line 58: | Line 58: | ||
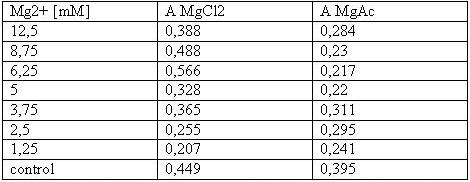
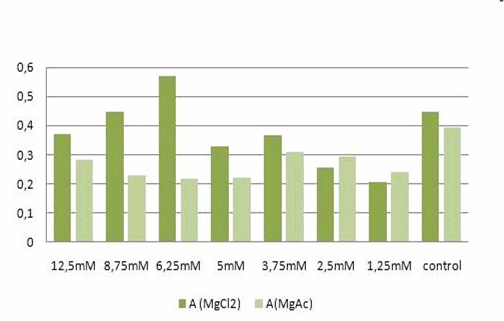
detected in a photometer at 570nm.<br> | detected in a photometer at 570nm.<br> | ||
<br> | <br> | ||
| - | B-cells (cell line j558lδmmb1nfleck) from | + | B-cells (cell line j558lδmmb1nfleck) from 10 ml dishes were |
| - | spun down and resuspended in 9ml Krebs-Ringer-Hepes (12 | + | spun down and resuspended in 9ml Krebs-Ringer-Hepes (12.5mM MgAc). |
| - | After incubation for | + | After incubation for 45 min the cells were spun down again and resolved |
| - | in | + | in 1 ml PBS. 5 µl of the suspension was mixed with 45 µl Trypan blue and |
the cells were counted in a “Neubauer cell chamber”.<br> | the cells were counted in a “Neubauer cell chamber”.<br> | ||
<br> | <br> | ||
| - | 293T cells were scraped off an | + | 293T cells were scraped off an 10 ml dish, spun down and resolved in 10 ml new DMEM medium. 500 µl of this suspension was given in each plate of a 6-well plate containing 4500 µl DMEM medium with different concentrations of Mg2+. 3 days later the media of 3 wells was sucked off and the cells were washed in PBS, then TA-buffer (Tris-Acetat buffer) was given to these wells. After 1h the TA-buffer was removed, the cells of all dishes were washed in PBS and 2ml new DMEM medium plus 500 µl MTT was added. After incubation for 3.5h at 37°C the cells were scraped off the wells and spun down at 13000 rpm for 5min. Then the pellet was resolved in 4 ml DMSO and 500 µl Soerensens’ reagent. Detection took place at 570 nm.<br> |
<br> | <br> | ||
<h2>Media</h2> | <h2>Media</h2> | ||
| Line 72: | Line 72: | ||
<ul> | <ul> | ||
<li>RPMI</li> | <li>RPMI</li> | ||
| - | <li>10%FCS </li> | + | <li>10% FCS </li> |
<li>HEPES (10mM) </li> | <li>HEPES (10mM) </li> | ||
<li>β-mercaptoethanol (50µM) </li> | <li>β-mercaptoethanol (50µM) </li> | ||
| - | <li>L-Glutamine ( | + | <li>L-Glutamine (2 mM)</li> |
| - | <li>1%Pen-Strep</li> | + | <li>1% Pen-Strep</li> |
</ul> | </ul> | ||
<br> | <br> | ||
| Line 84: | Line 84: | ||
<li>10% FCS </li> | <li>10% FCS </li> | ||
<li>5% PenStrep </li> | <li>5% PenStrep </li> | ||
| - | <li>L-Glutamine (1 | + | <li>L-Glutamine (1.5 mM) <br> |
</li> | </li> | ||
</ul> | </ul> | ||
<br> | <br> | ||
| - | Krebs-Ringer-Hepes (12. | + | Krebs-Ringer-Hepes (12.5 mM Mg2+):<br> |
<ul> | <ul> | ||
<li>NaCl (155 mM)</li> | <li>NaCl (155 mM)</li> | ||
| Line 94: | Line 94: | ||
<li>CaCl2 (2 mM)</li> | <li>CaCl2 (2 mM)</li> | ||
<li>MgCl2 (1 mM)</li> | <li>MgCl2 (1 mM)</li> | ||
| - | <li>MgAcetat (11. | + | <li>MgAcetat (11.5 mM)</li> |
<li>D-glucose (10 mM)</li> | <li>D-glucose (10 mM)</li> | ||
<li>Hepes (5 mM)</li> | <li>Hepes (5 mM)</li> | ||
| Line 106: | Line 106: | ||
<li>80 ml Aqua dest.</li> | <li>80 ml Aqua dest.</li> | ||
</ul> | </ul> | ||
| - | -> pH 10 | + | -> pH 10.5 with NaOH<br> |
<br> | <br> | ||
<h2>Binding measurement</h2> | <h2>Binding measurement</h2> | ||
| - | To test the binding between origamis and T-cells/B-cells | + | To test the binding between origamis and T-cells/B-cells 15 µl cell |
| - | suspension in Ringer (12 | + | suspension in Ringer (12.5 mM Mg2+) or TA-buffer (12.5 mM Mg2+) was mixed |
| - | with | + | with 15 µl of origamis on a µ-Slide (ibidi, µ-Slides 18 well-flat, Cat. |
No: 81824). Those slides are coated with Poly-L-Lysine, which fixes the | No: 81824). Those slides are coated with Poly-L-Lysine, which fixes the | ||
cells on the bottom of the slide. So the suspensions cells could be | cells on the bottom of the slide. So the suspensions cells could be | ||
| Line 121: | Line 121: | ||
<h3>Ca2+ measurement with microscope</h3> | <h3>Ca2+ measurement with microscope</h3> | ||
By binding of ligands to a receptor at the cell surface the cell reacts | By binding of ligands to a receptor at the cell surface the cell reacts | ||
| - | amongst others with a efflux of | + | amongst others with a efflux of calcium ions from the ER into the |
cytoplasm. To measure the intensity of activation one way is to | cytoplasm. To measure the intensity of activation one way is to | ||
| - | quantify the concentration or rather the increase of | + | quantify the concentration or rather the increase of calcium ions in the |
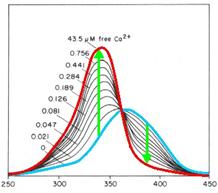
cytoplasm. Fura-2 is a fluorescent dye which change the quality | cytoplasm. Fura-2 is a fluorescent dye which change the quality | ||
dependent on the Ca2+ concentration. Fura-2AM (Fura-2-acetoxymethyl | dependent on the Ca2+ concentration. Fura-2AM (Fura-2-acetoxymethyl | ||
| Line 132: | Line 132: | ||
wavelengths is directly correlated to the amount of intracellular | wavelengths is directly correlated to the amount of intracellular | ||
calcium. Without Ca2+ the maximum emission results from excitation at | calcium. Without Ca2+ the maximum emission results from excitation at | ||
| - | 365nm. With Ca2+ the maximum emission change to excitation at | + | 365nm. With Ca2+ the maximum emission change to excitation at 340 nm and |
| - | the emission decrease by extinction at | + | the emission decrease by extinction at 380 nm.<br> |
So to measure properly it is necessary to alternate quickly between the | So to measure properly it is necessary to alternate quickly between the | ||
two excitation wavelengths. Excitation was measured with a high-end | two excitation wavelengths. Excitation was measured with a high-end | ||
| Line 144: | Line 144: | ||
'''Fura-2 Loading'''<br> | '''Fura-2 Loading'''<br> | ||
<u>Procedure:</u><br><br> | <u>Procedure:</u><br><br> | ||
| - | 1. | + | 1. 1 ml T-cell cellsuspension (in Ringer-Solution)<br> |
| - | 2. + 0. | + | 2. + 0.5 µl Pluronic F 127<br> |
| - | 3. + 0. | + | 3. + 0.5 µl Fura-Solution (2mM) and vortex<br> |
4. incubation at 37°C and 8% CO2 for 20 min <br> | 4. incubation at 37°C and 8% CO2 for 20 min <br> | ||
5. centrifuge at 1000 rpm (206 rcf) and 4°C for 5 min<br> | 5. centrifuge at 1000 rpm (206 rcf) and 4°C for 5 min<br> | ||
6. discard the supernatant<br> | 6. discard the supernatant<br> | ||
| - | 7. + | + | 7. + 100 µl Ringer-Solution for resuspension<br> |
<br> | <br> | ||
<h3>Ca2+ measurement with FACS</h3> | <h3>Ca2+ measurement with FACS</h3> | ||
| Line 156: | Line 156: | ||
of Indo-1, which is the Ca2+ complexing dye, and 0.5 μg/ml of | of Indo-1, which is the Ca2+ complexing dye, and 0.5 μg/ml of | ||
pluronic F-127, which fasilitates dye uptake (both Molecular Probes) 45 | pluronic F-127, which fasilitates dye uptake (both Molecular Probes) 45 | ||
| - | min at 37°C. After incubation, cells were distributed into to 1. | + | min at 37°C. After incubation, cells were distributed into to 1.5 ml |
eppendorf tubes and the washed with the medium we wanted to measure | eppendorf tubes and the washed with the medium we wanted to measure | ||
them. After washing, cells were resuspended in the according medium and | them. After washing, cells were resuspended in the according medium and | ||
| Line 185: | Line 185: | ||
<br> | <br> | ||
The MTT assays and the trypan blue staining proofed the tolerance of | The MTT assays and the trypan blue staining proofed the tolerance of | ||
| - | the used cells towards a concentration up to 12 | + | the used cells towards a concentration up to 12.5 mM Mg2+. This is the |
exact concentration in which the origami are produced and stored. The | exact concentration in which the origami are produced and stored. The | ||
lower absorbance in the tests with TA could possibly come from the | lower absorbance in the tests with TA could possibly come from the | ||
| Line 196: | Line 196: | ||
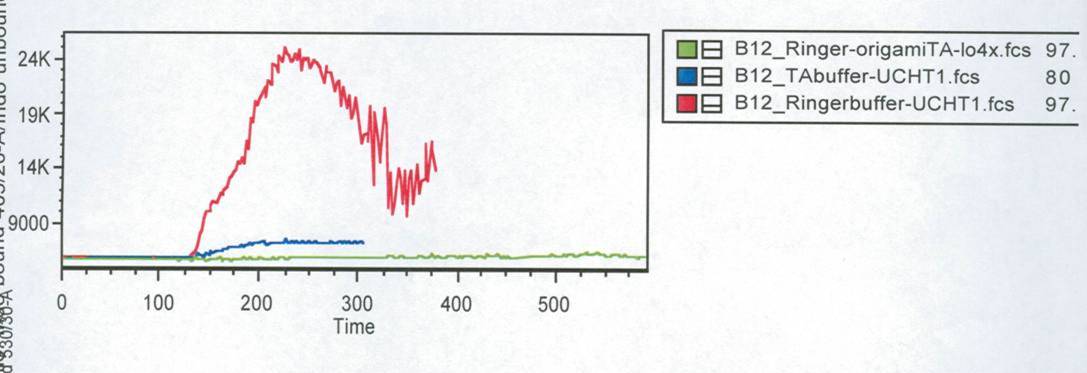
In this measurement we tried to activate T-Cells by clustering. | In this measurement we tried to activate T-Cells by clustering. | ||
Therefore we tested two different buffers, Krebs-Ringer-Hepes with | Therefore we tested two different buffers, Krebs-Ringer-Hepes with | ||
| - | 12 | + | 12.5 mM Mg2+ buffer and TA with 12.5 mM Mg2+. As positive control we used |
UCHT1 (=anti-CD3), which can stimulate T-cells (Susana Minguet, Vol. | UCHT1 (=anti-CD3), which can stimulate T-cells (Susana Minguet, Vol. | ||
26, Page 43-54).<br> | 26, Page 43-54).<br> | ||
| Line 221: | Line 221: | ||
those Origami on the AFM. None of the Origami which we used were | those Origami on the AFM. None of the Origami which we used were | ||
stable, so probably that is the reason why we couldn´t see any signal | stable, so probably that is the reason why we couldn´t see any signal | ||
| - | by adding NIP-Origami. To | + | by adding NIP-Origami. To confirm this conclusion this measurement would |
have to be carried out again.<br> | have to be carried out again.<br> | ||
<br> | <br> | ||
| Line 260: | Line 260: | ||
[[Image:TeamFreiburg2008_Bindungsmessung_1.jpg|600 px]]<br> | [[Image:TeamFreiburg2008_Bindungsmessung_1.jpg|600 px]]<br> | ||
<small>Fig. 5: B-cells with NIP linked Origami (left) and without NIP (right) in 50% TA (Tris-Acetat) and 50% Krebs-Ringer-Hepes buffer, </small><br> | <small>Fig. 5: B-cells with NIP linked Origami (left) and without NIP (right) in 50% TA (Tris-Acetat) and 50% Krebs-Ringer-Hepes buffer, </small><br> | ||
| - | <small>both buffers contain 12. | + | <small>both buffers contain 12.5 mM Mg2+ </small> |
<br> | <br> | ||
<br> | <br> | ||
Revision as of 23:08, 29 October 2008
 "
"

