Team:KULeuven/Model/Memory
From 2008.igem.org
Contents |
Memory
Position in the system
Describing the system
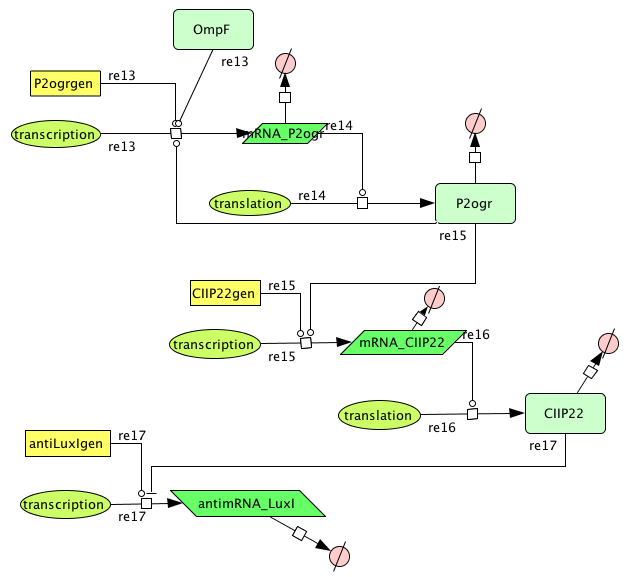
This system must activate the cell death system after one light pulse. As long as there is no light, there is no P2ogr, no CIIP22 and a lot of antimRNA_LuxI. The antimRNA_LuxI blocks the cell death system. When light is turned on OmpF increases. This causes P2ogr and CIIP22 to increase and antimRNA_LuxI to decrease. This activates the system. When light is turned off, the P2ogr concentration is large enough to maintain itself. This way antimRNA doesn't increase. The system stays activated.
ODE's
Parameters
| Name | Value | Comments | Reference |
|---|---|---|---|
| Degradation Rates | |||
| dP2ogr | 0.002265 s-1 | ||
| dRNA_P2ogr | 0.002265 s-1 | [http://www.pubmedcentral.nih.gov/picrender.fcgi?artid=124983&blobtype=pdf link] | |
| dP22CII | 0.002311 s-1 | This value is to low. The correct value is used in the final model. | [http://www.pnas.org/content/88/12/5217.abstract?sid=27806463-33af-4a78-b964-f15872433865 link] |
| dRNA_P22CII | 0,0022651 s-1 | [http://www.pubmedcentral.nih.gov/picrender.fcgi?artid=124983&blobtype=pdf link] | |
| dantimRNA_luxI | 0.0045303 s-1 | [http://www.pubmedcentral.nih.gov/picrender.fcgi?artid=124983&blobtype=pdf link] | |
| Transcription Rates | |||
| kP2ogr | 0.0125 s-1 | estimate | |
| kP22CII | 0.0125 s-1 | estimate | |
| kAntimRNA_LuxI | 0.0094 s-1 | estimate | |
| Dissociation Constants | |||
| KP2ogr | 4.2156 | Used in two reactions for activator control at the transcription of P2ogr mRNA and CIIP22 mRNA | [http://www.jbc.org/cgi/content/abstract/258/17/10536?maxtoshow=&HITS=10&hits=10&RESULTFORMAT=&fulltext=P22+c2+repressor&andorexactfulltext=and&searchid=1&FIRSTINDEX=0&sortspec=relevance&volume=258&resourcetype=HWCIT link] |
| KR0053_P22CII | 0.1099 | [http://www.jbc.org/cgi/content/abstract/258/17/10536?maxtoshow=&HITS=10&hits=10&RESULTFORMAT=&andorexactfulltext=and&searchid=1&FIRSTINDEX=0&sortspec=relevance&firstpage=10536&resourcetype=HWCIT link] | |
| Hill Cooperativity | |||
| n | 2 | Used for all reactions throughout the memory submodel using Hill kinetics | |
Models
CellDesigner (SBML file)
- Figure: CellDesigner system representation
Matlab
Problem
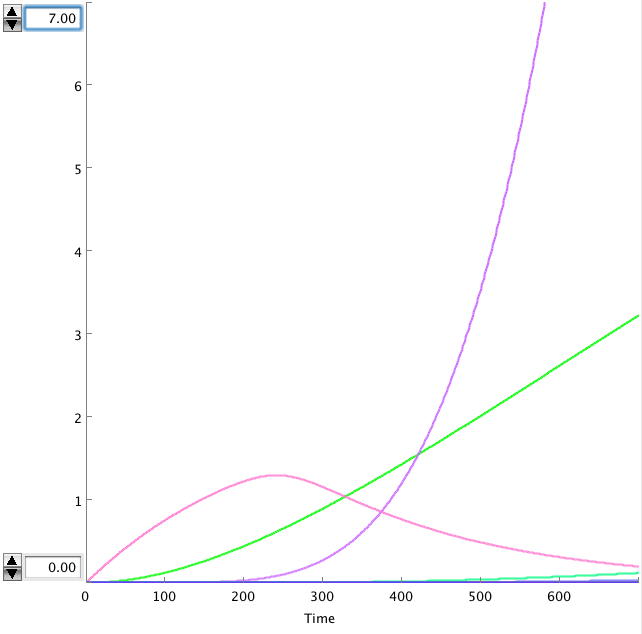
The OmpF promoter is not ideal. When there is no light the transcription rate is still 0.00005. This means that P2ogr will slowly build up, activating the system. In this case the memory is in 0-state when the stationary state isn't reached yet. The 1-state is the stationary state. So the system automatically ends up in state 1 after some time (300s). This can be seen in the figure below.
- Figure: Celldesigner simulation of the memory system. CIIP22(purple), P2ogr(green), AntimRNA(pink).
The system can only stay in 0-state for 300 sec. This makes it completely useless.
Alternative
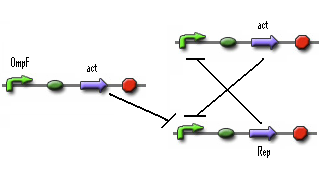
In the previous system the 0-state isn't actively maintained. It's just 'not stationary state'. So we need to search mathematical system that has 2 stationary states. A possible solution is given below.
Describing the system
- Figure: Part representation of alternative system
When this system starts Rep build up because Rep represses the Act promoter better then Act represses the Rep promoter. The Rep concentration stays high and the Act stays low. This is the 0-state. When there is light, the OmpF promoter is activated and the Act concentration is increased. This represses Rep promoter. The Rep concentration decreases and the Act promoter is activated. The Act concentration keeps increasing. When the light pulse ends the Act concentration is high enough to repress the Rep promoter, Act concentration stays high and Rep concentration stays low. This is the 1-state.
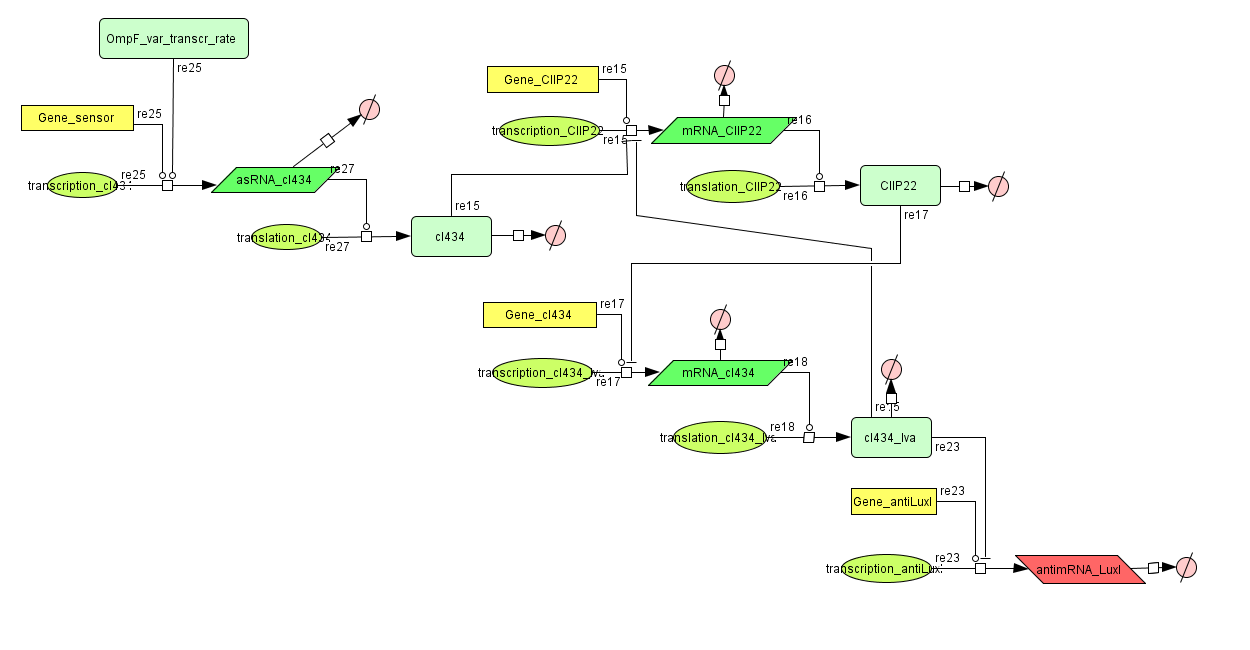
Using typical values this system can be tested in CellDesigner.
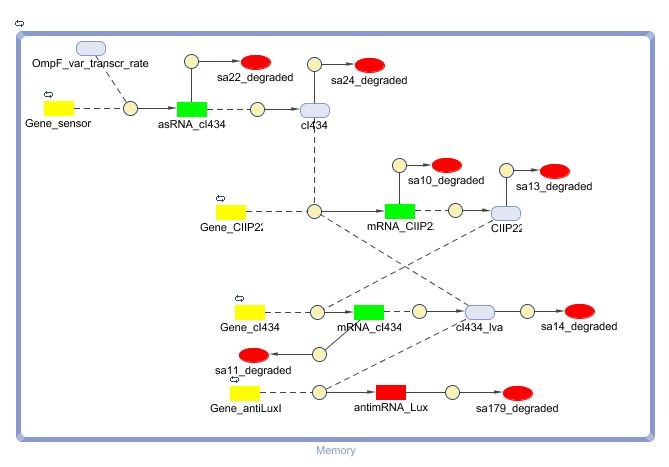
- Figure: Celldesigner system representation
Parameters
These typical parameters are:
| Name | Value | ||
|---|---|---|---|
| Degradation Rates | |||
| dact | 0.0011552 s-1 | ||
| dRNA_act | 0.0023105 s-1 | ||
| drep | 0.0011552 s-1 | ||
| dRNA_rep | 0.0023105 s-1 | ||
| Transcription Rates | |||
| kact | 0.006 s-1 | ||
| krep | 0.0125 s-1 | ||
| Translation rate | |||
| kact | 0,166666 | ||
| krep | 0,166666 | ||
| Dissociation Constants | |||
| Kact-rep | 4.2156 | ||
| Krep-act | 4.2156 | ||
| Hill Cooperativity | |||
| n | 2 | ||
Results
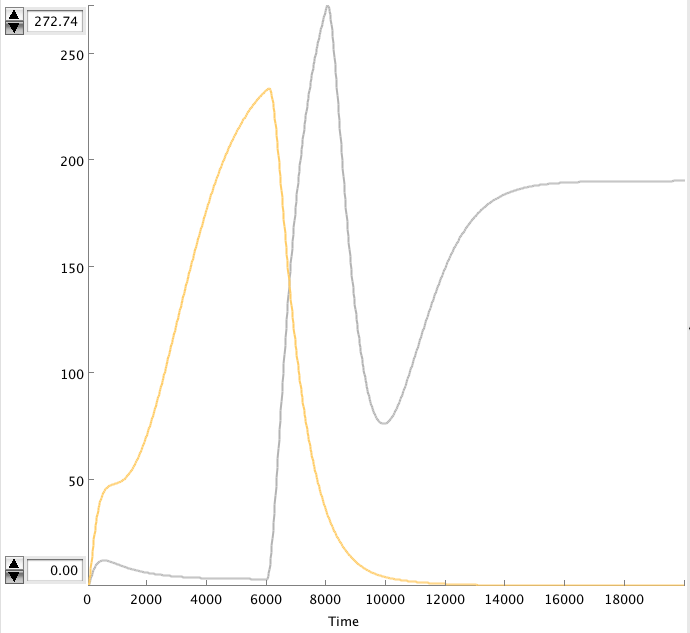
CellDesigner gives the following simulation when OmpF transcription rate changes from 0.0001 to 0.01 at t=6000 sec for 2000 sec.
- Figure: Celldesigner simulation of the alterative system. Act(grey), Rep(yellow)
The OmpF peak causes the Act concentration to rise and the Rep to decrease. The high Act concentration keeps the Rep concentration low. This causes the Act concentration to stay high.
New model
Describing the system
This is the same system as the alternative. The role of act is taken up by cI434 and rep by cIIP22.The output of this system is given in by RNA production that repressed the LuxI production.
Models
Matlab (SBML file)
ODE's
Parameters
| Name | Value | Comments | Reference |
|---|---|---|---|
| Degradation Rates | |||
| dcIIP22 | 2.8822E-4 s-1 | this part has a LVA-tag, so we estimate a 40 min half-life | |
| dmRNA_cIIP22 | 0.00462 s-1 | [http://www.pubmedcentral.nih.gov/picrender.fcgi?artid=124983&blobtype=pdf link] | |
| dcI434 | 2.8822E-4 s-1 | this part has a LVA-tag, so we estimate a 40 min half-life | |
| dmRNA_cI434 | 0.00462 s-1 | [http://www.pubmedcentral.nih.gov/picrender.fcgi?artid=124983&blobtype=pdf link] | |
| dantimRNA_luxI | 0.00462 s-1 | [http://www.pubmedcentral.nih.gov/picrender.fcgi?artid=124983&blobtype=pdf link] | |
| cII434 regulated promotor | |||
| ktranscr | 0.125 s-1 | estimate | |
| Km | 0.8708 | [http://jb.asm.org/cgi/content/abstract/187/16/5624?maxtoshow=&HITS=10&hits=10&RESULTFORMAT=&searchid=1&FIRSTINDEX=0&volume=187&firstpage=5624&resourcetype=HWCIT link] | |
| cIIP22 regulated promotor | |||
| ktranscr | 0.125 s-1 | estimate | |
| Km | 0.1099 | [http://www.jbc.org/cgi/content/abstract/258/17/10536?maxtoshow=&HITS=10&hits=10&RESULTFORMAT=&andorexactfulltext=and&searchid=1&FIRSTINDEX=0&sortspec=relevance&firstpage=10536&resourcetype=HWCIT link] | |
| translation rates | |||
| ktransl_cI434 | 0.038888 s-1 | eff. 0.07 | |
| ktransl_cIIP22 | 0,555555 s-1 | eff. 1 | |
| Hill Cooperativity | |||
| n | 2 | Used for all reactions throughout the memory submodel using Hill kinetics | |
Results
Simulation
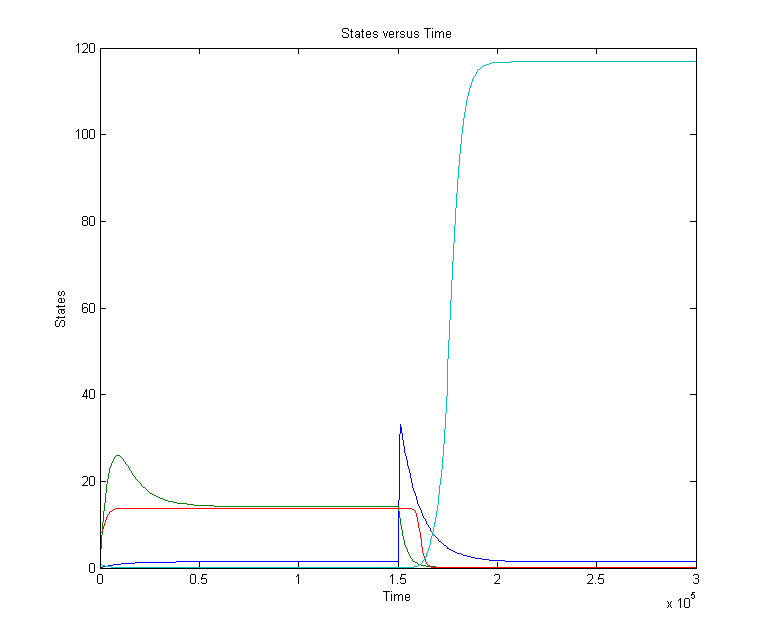
CellDesigner gives the following simulation when OmpF transcription rate changes from 0.0001 to 0.0125 at t=20000 sec for 1000 sec (17min).
There is a clear change. The cIIP22 amount drops and the cI434 increases. The high cI434 amount will repress the RNA production. These RNA amount are small and can’t be see on the graph. It might be necessary to increase the RNA production.
Mathematical Analysis (Maple file)
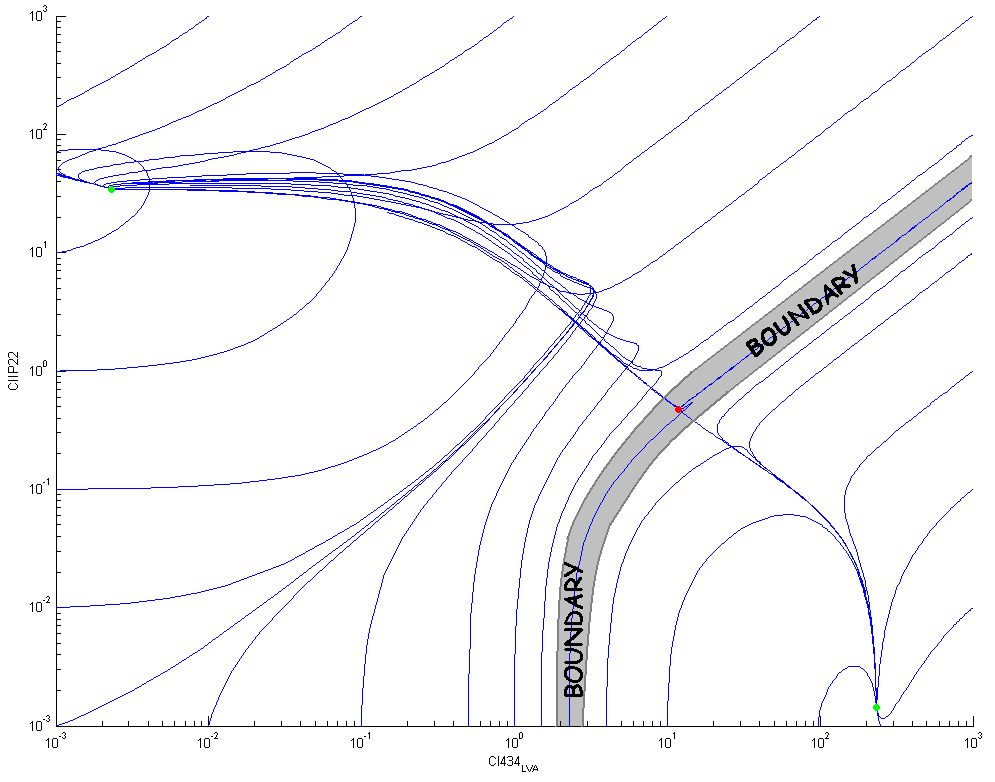
The existence of the two stable states of the memory (cI434 high and cIIP22 low / cI434 low and cIIP22 high) can be mathematically proven.
First we define the equilibrium points of the following differential equation system:
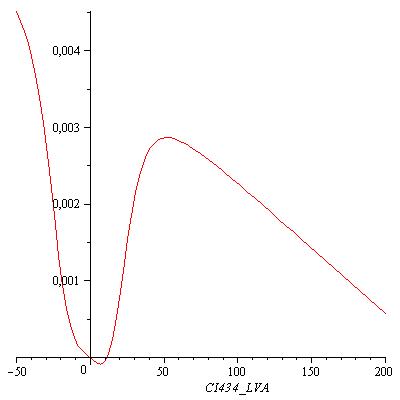
The equilibrium points are defined as the points for which all the derivatives are zero. Solving this non-linear system results in finding the roots of the equation
If [OmpF] equals 0.0001, this equation has three real zeros ([CI434 = 2.551596228], [CI434 = 40.65751021], [CI434 = 320.7902620]) and two conjugated imaginary zeros ([CI434 = -21.30179624+33.02466798*I], [CI434 = -21.30179624-33.02466798*I]) as can be seen in the following figure:
The real roots of the system for all the variables are:
| Zero 1 | Zero 2 | Zero 3 | |
|---|---|---|---|
| [CI434] | 2.551596228 | 40.65751021 | 320.7902620 |
| [mRNACI434] | 0.02165211656 | 0.3450080152 | 2.722134509 |
| [CIIP22] | 67.86681025 | 0.2982960778 | 0.004793831084 |
| [mRNACIIP22] | 0.2822500555 | 0.001240578188 | 0.00001993697780 |
The stability of the three real zeros is defined by the eigenvalues of the Jacobian of the differential equation system. This Jacobian equals
The eigenvalues for Zero 1 are all negative (-0.2312299809e-2, -0.4575424931e-2, -0.4663289165e-2, -0.3294760947e-3). This is also the case for Zero 3 (-0.2322149252e-2, -0.4504274069e-2, -0.4727420465e-2, -0.3266462137e-3). These two zero's represent the two stable states of the memory system. Zero 2 has a positive eigenvalue and is therefore unstable.
The following figure shows some trajectories in the phase plane ([CIIP22],[CI434]): there is a clear boundary between the two stable equilibrium points (the green dots) that goes through the unstable equilibrium point (the red dot). This boundary divides the two dimensional phase plane in two separate basins of attraction.
 "
"


