Team:UC Berkeley/Modeling
From 2008.igem.org
Contents |
Introduction
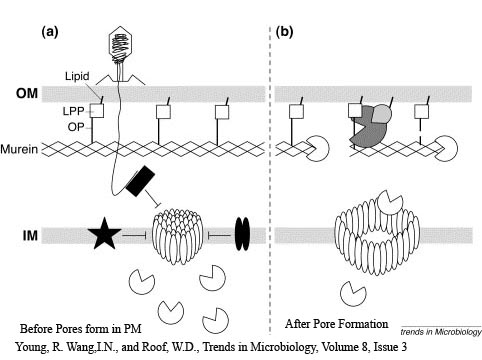
The Lambda phage lysis device consists of three protein;
Holin - inner membrane-bound proteins that when complexed with other holin proteins, create holes in the membrane that allow lysozyme access to the periplasm.
Antiholin - inner membrane-bound protein that binds to and inactivates holin to produce a holin-antiholin dimer
Lysozyme - destroys peptidoglycan in the periplasm, resulting in cell lysis
Governing Equations
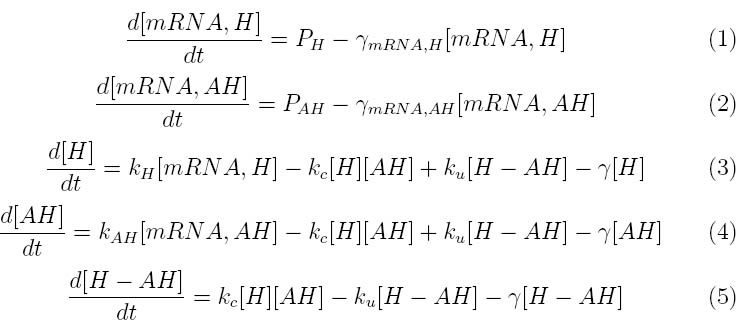
The kinetics of the Lambda phage lysis device was modeled to help our team gain an insight into the behavior of our system. The below equations describe our system
Where P_H and P_AH represent the mRNA promoter strengths, gamma_mRNA,H and gamma_mRNA,AH are the degradation rates for holin and antiholin respectively and gamma is the protein degradation rate, k_H , k_AH and k_c represent the rate constants for holin and antiholin formation and the coupling rate for the holin-antiholin dimer.
Transfer Function and Dimensionless Parameters
At steady state,
By making this assumption, the system of equations can be simplified into the following transfer function
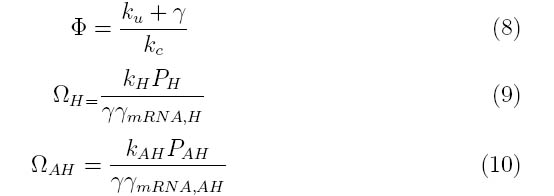
Where the system can be divided into three dimensionless parameters which describe the behavior of the holin-antiholin dimer and the holin and antiholin proteins
Graphs
Physiologically relevant values for omega_H, omega_AH and phi were estimated based on rate constants for similar proteins. This system was input into MatLab to produce the following graph. Since there is a degree of uncertainty in these estimates, the graph spans several orders of magnitude above and below our estimated values.
The literature indicates that at the time of lysis, cells infected with lambda phage have approximately 1000 holin proteins. Therefore, the critical concentration of holin (Hc) was set at 1000 holin proteins per cell.
The horizontal line at y=1 represents the critical holin concentration needed induce lysis. As one would expect by looking at the dimensionless value for holin (omega_H), as the strength of the holin promoter increases, the amount of holin at steady state increases.
The graph also shows that the system is not very sensitive to small amounts of antiholin. Larger amounts of antiholin push the system equilibrium to the left and would require a stronger promoter on holin or a weaker binding interaction between holin and antiholin to reach critical concentration.
Varying phi, the dimensionless parameter that describes the coupling and uncoupling behavior of the holin-antiholin dimer, reveals that when the binding of holin-antiholin is stronger, a stronger promoter is required to reach the critical holin concentration.
Conclusions
The graphs above reveal the important parameters in the system and allow choose appropriate promoters and phage proteins to optimize lysis behavior.
 "
"


