Team:Waterloo/Modeling
From 2008.igem.org
| Home | The Team | The Project | Parts Submitted to the Registry | Modeling | Notebook | Sponsors |
|---|
Contents |
Modeling Goal
Currently, the modelling team is considering issues that would be relevant to any industrial application of UW's 2008 project. Specifically, we are interested in determining the amount of time for which the genome of a cell should be exposed to the endonuclease to ensure, with a given percentage certainty, that the bacterial population is destroyed. In addition, we would like to know the relationship between this amount of time and the strength of the promoter used for the endonuclease.
Our Approach
To achieve our goal, a computer simulation of the activity of the endonuclease molecules inside a virtual cell will be used. In this simulation, endonuclease molecules will be generated randomly at a rate determined from empirical data, and their movement will be given by three-dimensional Brownian motion. A region of space within the virtual cell will be designated as the genome, with cut sites at the appropriate locations. The computer will register "cuts" to the genome whenever one of the endonucleases comes into contact with a cut site. After a predetermined number of "cuts" have occurred, the genome will be classified as degraded (we are assuming that after this many cuts have taken place, the genome is certain to be destroyed).
The rate of endonuclease production in our simulation will rely on empirical data provided by the lab team. The lab team will obtain a measure of the rate of cutting of the endonuclease, by measuring the number of test-plasmids (each containing a cut site) that remain after being exposed to the endonuclease for various amounts of time. We will then adjust the endonuclease production parameter in our model, until our simulation produces comparable results to the empirical data under corresponding conditions. In this way we hope to calibrate our model to a reasonable approximation of reality.
Progress
To produce our simulation, we edited a pre-existing open-source simulation project called [http://theileria.ccb.sickkids.ca/CellSim/overview.php Cell++]. Cell++ was designed to simulate metabolic and intra-cellular signalling pathways. We used the signalling simulation capabilities, with a few modifications, to simulate the interaction of the endonuclease with the genome's cut sites as described above.
Various parameters in the program can be easily specified, such as the rate of production of endonuclease, the rate of movement of the endonuclease, and the number of cut sites that need to be destroyed before the cell is considered to be degraded. After obtaining and analyzing empirical data, these parameters may be adjusted to match the real world as closely as possible. For now, the simulation will use ballpark figures, but will be run multiple times with different parameter values. This will give us an idea of the sensitivity of the data to the parameters we vary.
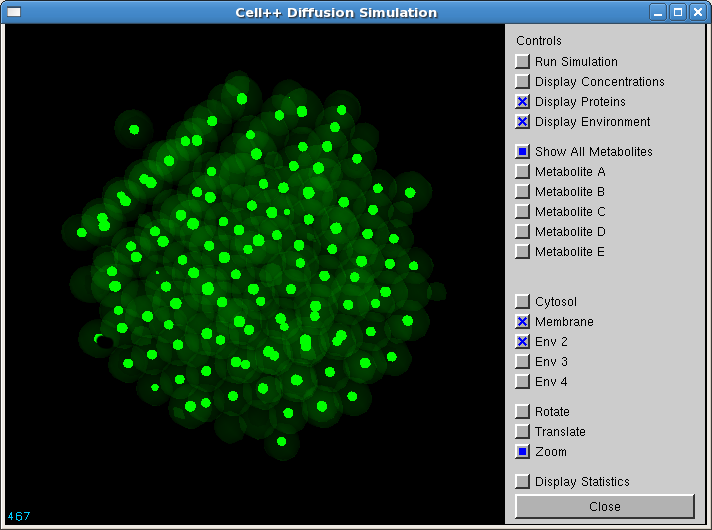
Below is a screenshot of Cell++ in graphical mode, the circles representing endonuclease. The cut sites are not visible in this screenshot.
Our modifications to Cell++ can be downloaded below. This download only contains the files we modified; the original Cell++ code must be downloaded as well in order for the simulation to function.
- Download [http://theileria.ccb.sickkids.ca/CellSim/releases/Cell++.0.92.tar.gz Cell++]
- Download our modifications
Unzip our modified files into the Cell++/3d/met directory, overwriting the existing files.
Preliminary Analysis
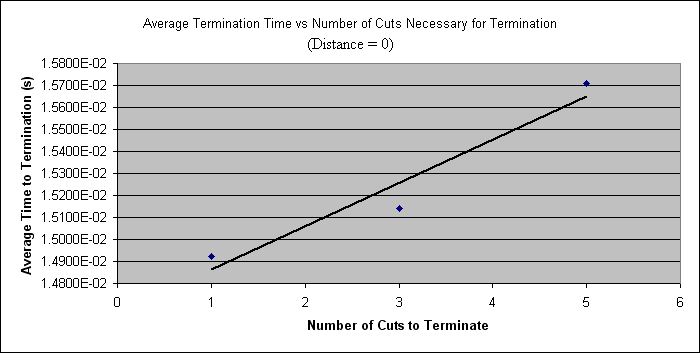
In our first simulations, we varied the number of cut sites required for termination, and the point in the cell at which the endonuclease was created. The latter piece of data is represented terms of distance from a reference point; the first point was an arbitrary point close to the genome (distance = 0), and in subsequent simulations the endonuclease is generated at points of varying distance from this reference. Our data is summarized below.
| Distance (micrometers) | Number of Cut Sites to Terminate | Average Time to Termination (seconds) |
|---|---|---|
| 0 | 1 | 1.49e-02 |
| 3 | 1.51e-02 | |
| 5 | 1.57e-02 | |
| 0.71 | 1 | 4.08e-02 |
| 3 | 4.34e-02 | |
| 5 | 4.66e-02 | |
| 1.42 | 1 | 6.41e-02 |
| 3 | 6.65e-02 | |
| 5 | 6.93e-02 |
Below, the data for the distance = 0 case is plotted.
 "
"

