Team:UC Berkeley/Modeling
From 2008.igem.org
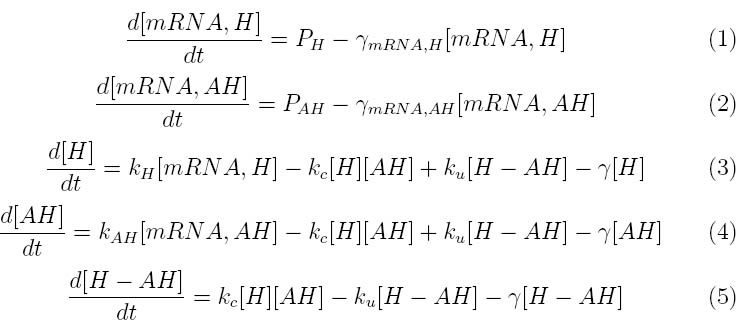
The kinetics of the Lambda phage lysis device was modeled to help our team gain an insight into the behavior of our system. The below equations describe our system
Where P1 and P2 approximate the mRNA promoter strength and /omega_mH and mH are the degradation rates for holin and antiholin respectively. kH , kAH and kc represent the rate constants for holin and antiholin formation and the coupling rate for the holin-antiholin dimer.
The literature indicates that at the time of lysis, cells infected with lambda phage have approximately 1000 holin proteins. Therefore, the critical concentration of holin (Hc) was set at 1000 holin proteins per cell.
At steady state,
The system can be simplified into the following transfer function
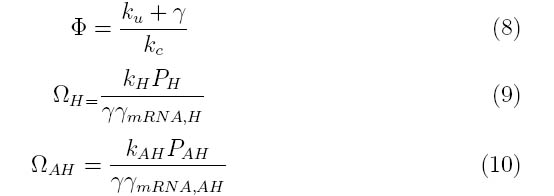
Where $\Omega_H$, $\Omega_{AH}$ and $\phi$ are represented by the following collections of constants
Using MatLab, graphs of the system were produced
 "
"


