Team:Bologna/Software
From 2008.igem.org
| HOME | TEAM | PROJECT | MODELING | WET-LAB | SOFTWARE | SUBMITTED PARTS | BIOSAFETY AND PROTOCOLS |
|---|
Visual Fluo Bacteria: a fluorescence image analisys software
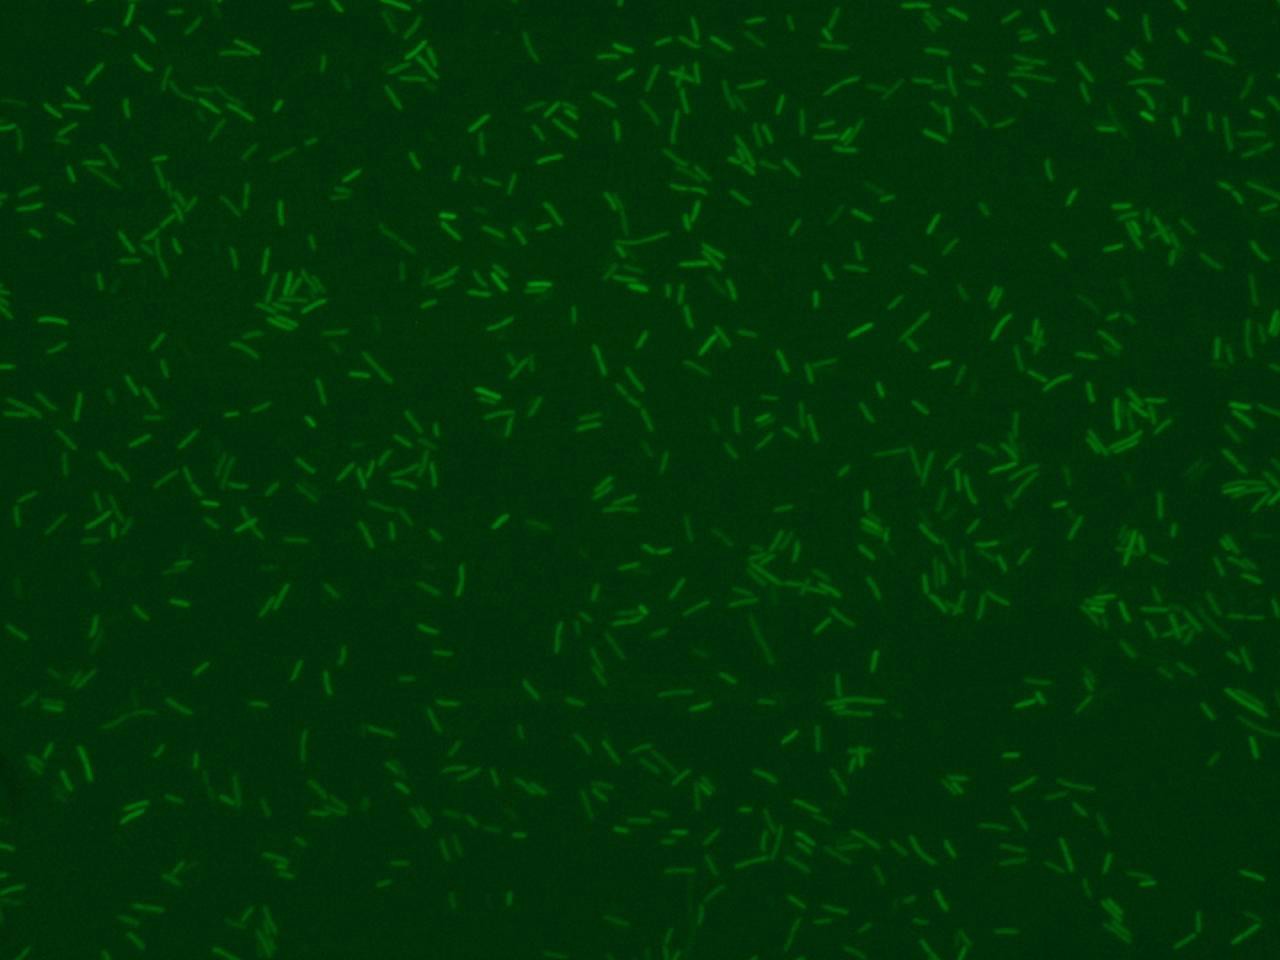
Promoter activity can be monitored using fluorescent proteins as reporters and the temporal fluorescence response can be detected by imaging elaboration.
Using microscopy analysis, we can overlap fluorescence data with bacteria’s morphology informations, trying to follow the single bacterium behavior that is impossible to be detected with fluorimeters. In addition, starting from fluorescence image analysis, we can get informations about the size and number of bacteria in a single view.
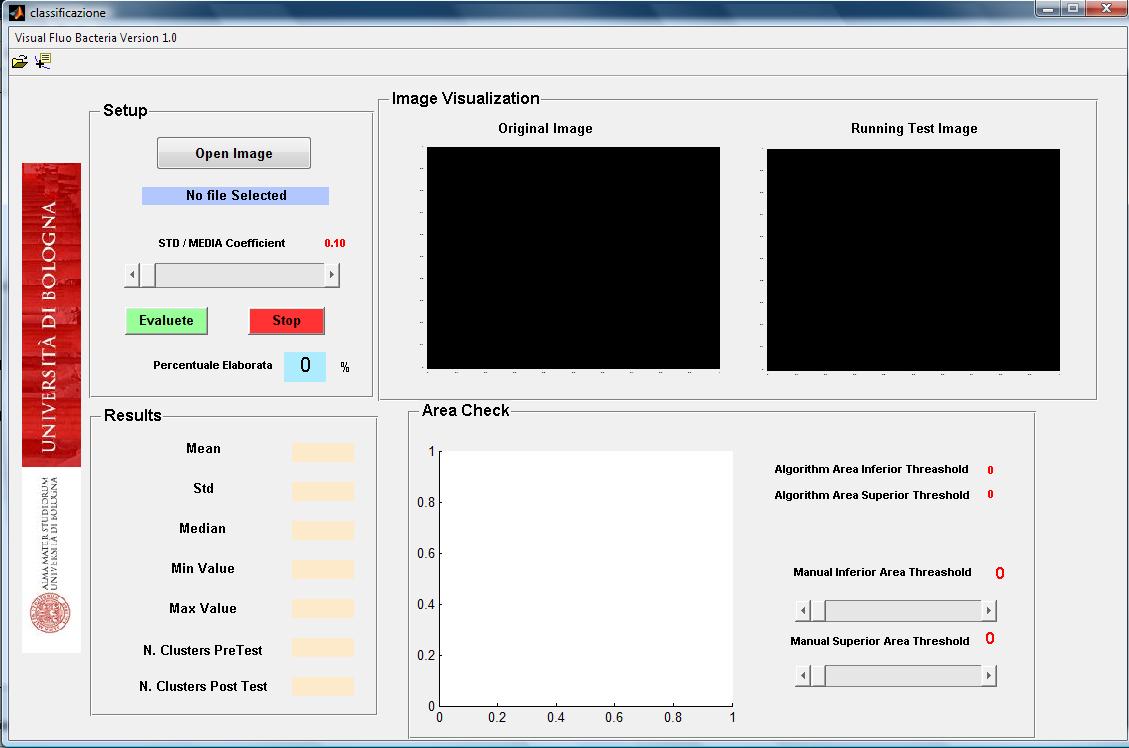
The implemented software is an easy and intuitive approach developed to assess the promoter activation dynamic in terms of fluorescence mean value per bacterium and standard deviation.
Bacterial area, the selected population size and the chance to discard bacteria with higher standard deviation and mean fluorescence values, are all together settings that can be fine tuned with the selected software. These parameters are relevant in order to select always the bacteria population in the same physiological state and to discard not- bacterial segmented clusters.
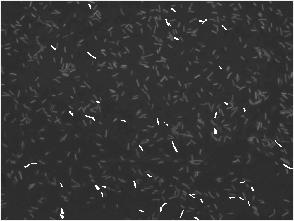
Example of analisys with very selective parameters (low ratio std/mean and narrow range of area dimensions)

|
The ratio standard deviation / mean fluorescence referred for each bacteria is used to throw away during the final analysis the bacteria that lie on another focal layer and they aren’t focused correctly.
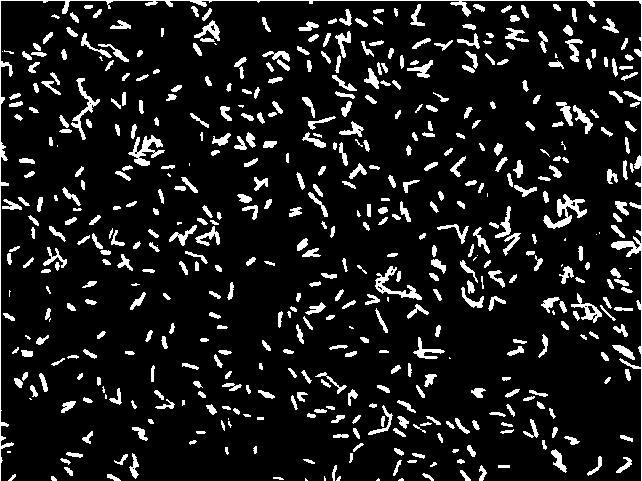
The algorithm reads image fluorescence and converts it into a "black and white" one that is then filtered by Top Hat filter to correct uneven illumination when the background is dark. The following step is needed to compute the global threshold in order to convert an intensity image to a binary image using Otsu’s method. The image is then ready to be scanned, pixel by pixel, to detect clusters (bacteria) and obtain final informations about their area, fluorescence mean (in RGB channel: R for RFP, G for GFP, B for CFP) and standard deviation. All the data are processed with area and focus efficiency parameters to estimate the population fluorescence mean, standard deviation, median, minimal and maximal fluorescence levels.
The software allows an original photo analysis with “white colored bacteria” in order to underly exactly which bacteria the data are coming from.
To download the program and relative user manual, you can click on the following icons.
![]() Visual Fluo Bacteria 1.0
Visual Fluo Bacteria 1.0
Note: after decompacting file, execute and run classificazione.m
![]() User Manual
User Manual
Microscopy system for fluorescence image analysis
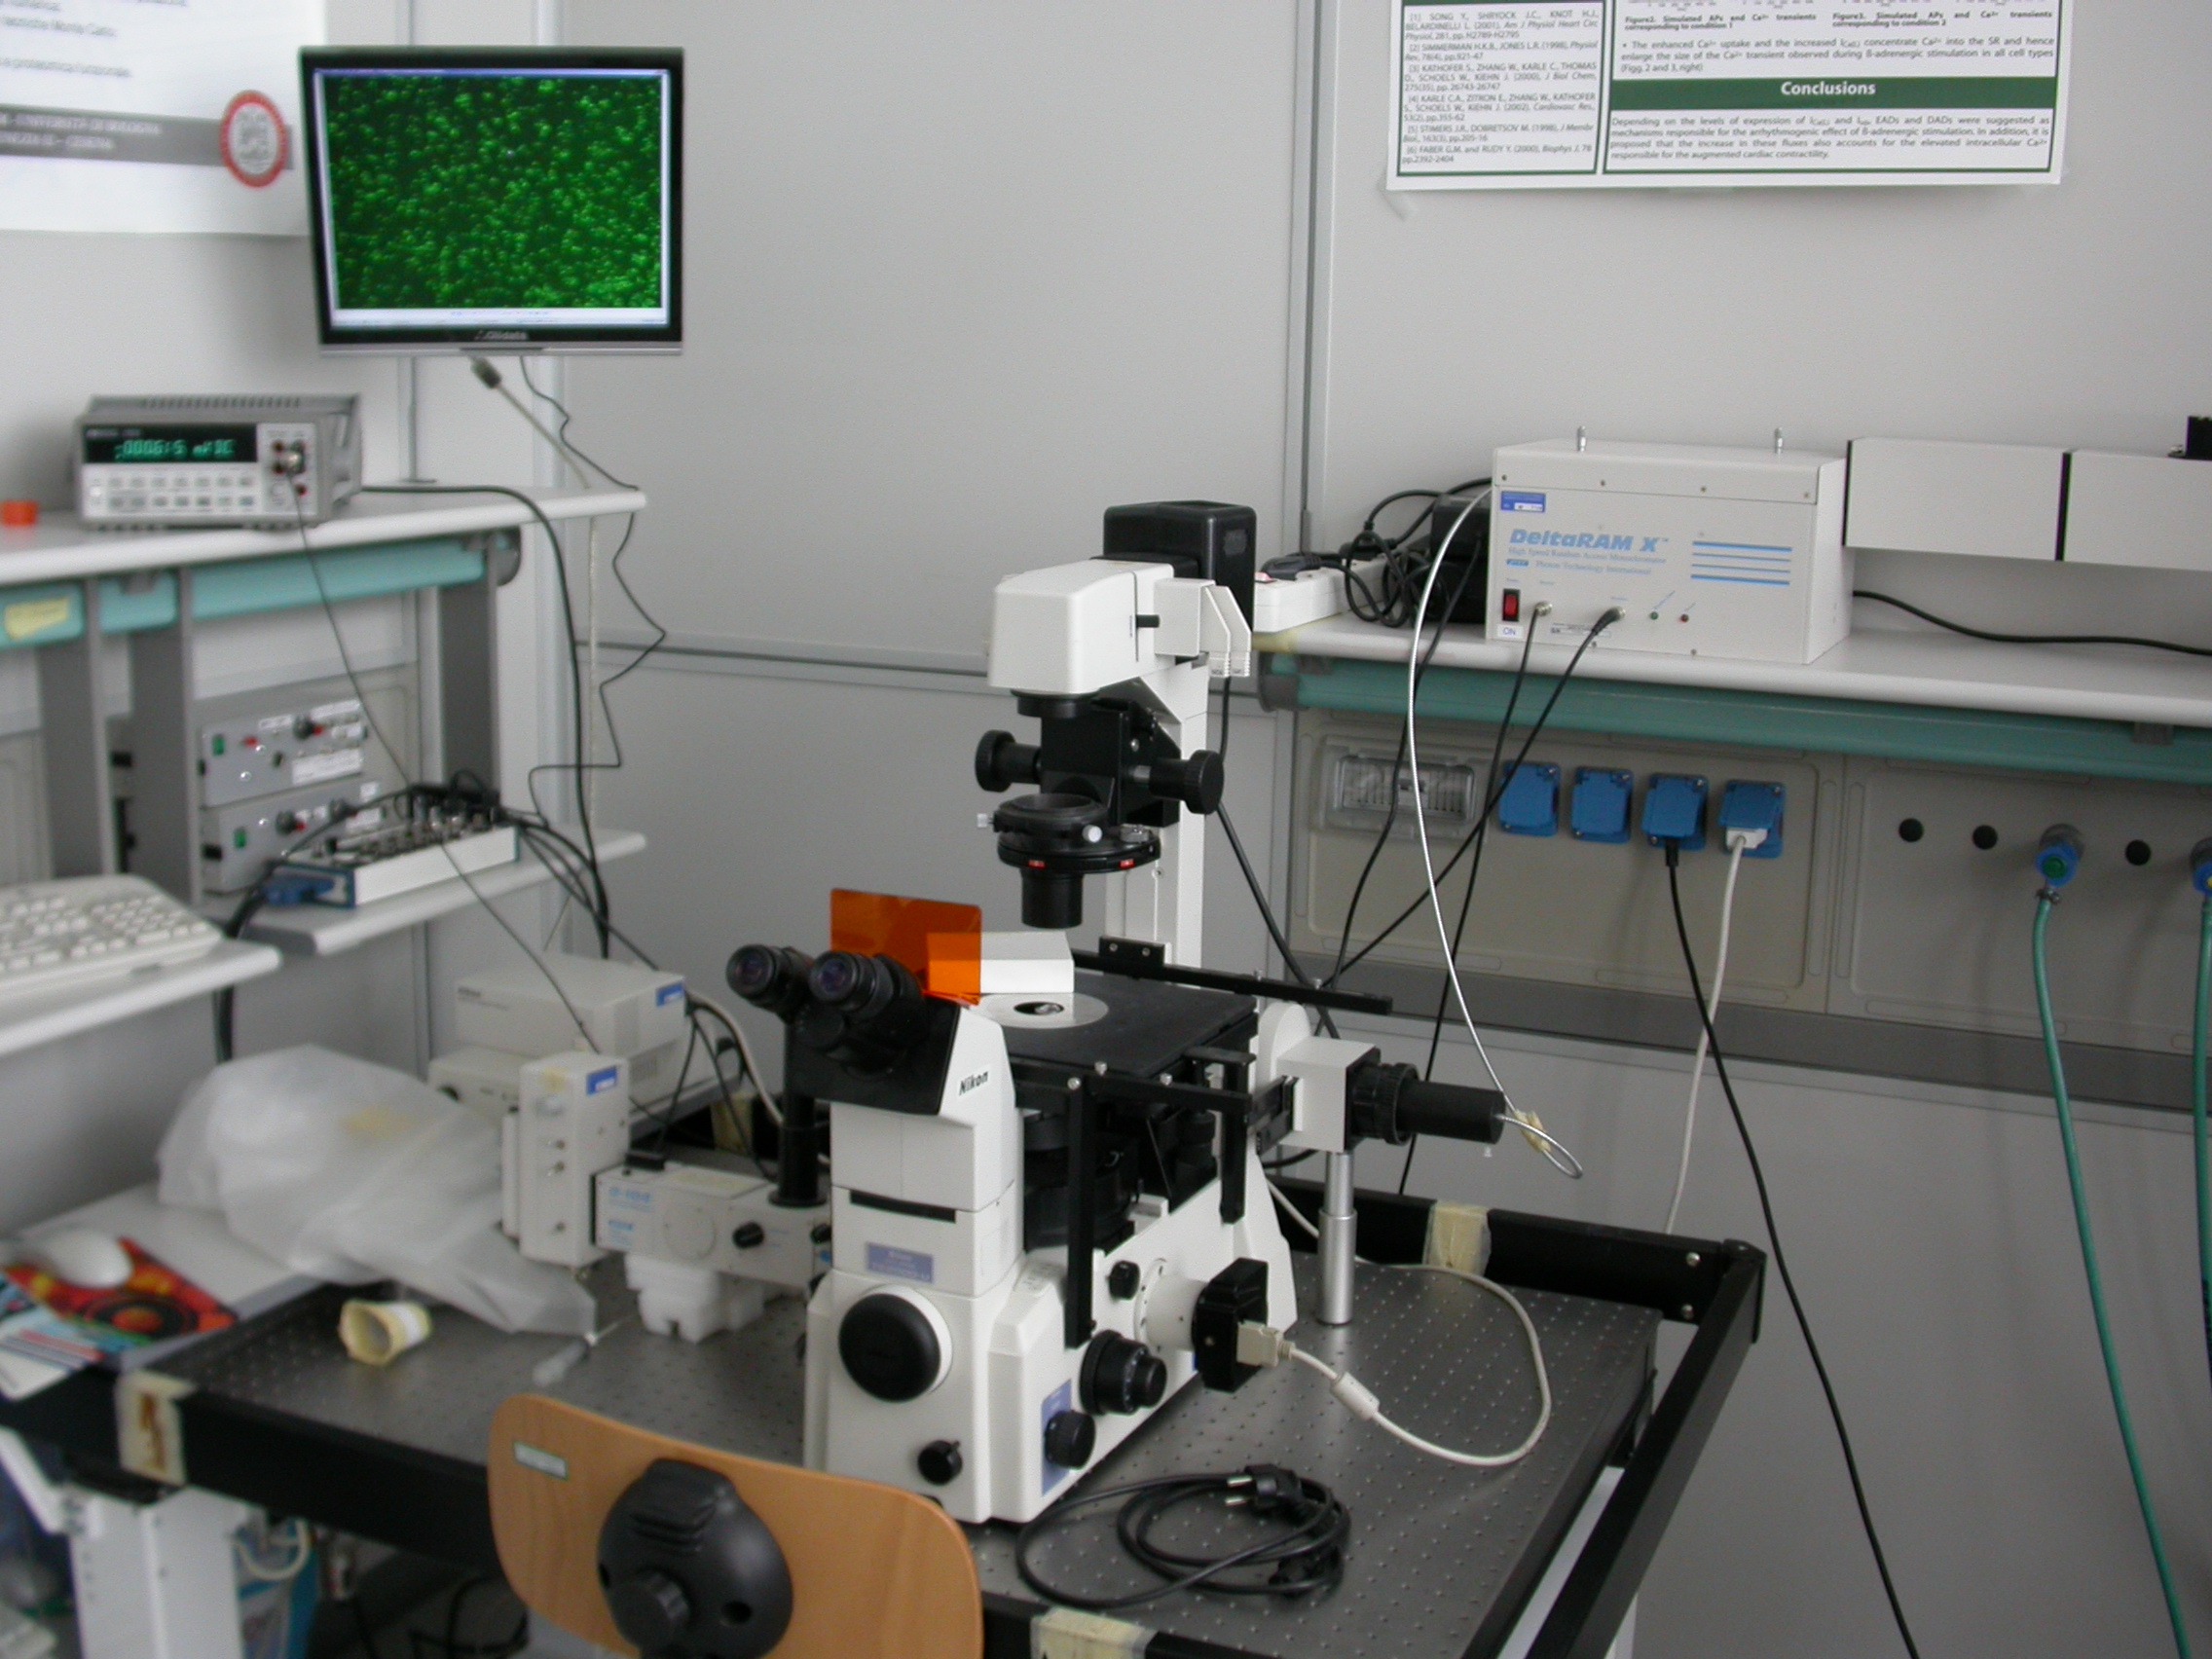
The illumination system is composed of a 75 Watt Xenon arc lamp connected to a Photon Technology Instruments DeltaRAM X monochromator, which breaks up a single polychromatic light beam into several monochromatic light beams (with only one wavelength each). Only the selected wavelength can pass through the output port and reach the microscope.
The system’s core is a Nikon Eclipse TE2000-U inverted fluorescence microscope. For GFP image acquisition we used a B-2A filter by Nikon with an excitation band between 450 and 490 nm and the optimal emission placed at 520 nm.
The camera used to acquire images and film segments is a Nikon DS-5m with a DS-U1 controller. This one receives the acquired signal form the camera through a serial connection and sends it to the PC through an USB slot. Nikon also supplied an interface software for image acquisition and elaboration.
The control software is implemented in a Labview environment and permits the regulation of the excitation wavelength and the calibration of the system. It also pictures the output signal from the photomultiplier, which can be memorized and elaborated.
D.N.A.(Data Network Acquisition) software
The idea from which was born this application is to realize a database registry like, in order to share with all
the faculty of the bologna university parts and interesting project. The devolpment starts from the
registry, which is well structured and an important source of information, we want so to create a tool
that permits to query automatically the web page of the registry to achieve the data of a part and
compare with ours. We start to develop a tools that scans the registry page to find three
parameters:the registry code, the partial description of the parts and the sequence.
There are three research modality included in this tools:
- INPUT :code OUTPUT:sequence and partial description;
- INPUT:parts or subparts of the name OUTPUT:all the parts which share that name;
- INPUT:sequence OUTPUT:all tha parts that match that sequence;
It's possible to imit the search to a selected categories of the registry or to extends to all with a drop
down menù.
The software was developed in java language to give the possibility to run it on all the type of
machine provided thath you have a java virtual machine.
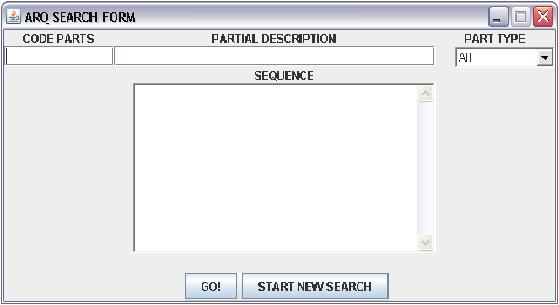
The user's interface is friendly an very simple:
the REGISTRY CODE PARTS requires the standard registy code BBa_XXXXX, the PARTIAL DESCRIPTION is a free text field, where can be writted any keywords of the research the TYPE PARTS is a drop down menù with twelve option:
- measurement
- generator
- composite
- rna
- dna
- conjugation
- reporters
- signalling
- rbs
- regulatory
- terminator
- all
to limit only in a restricted arts of the registry the search.
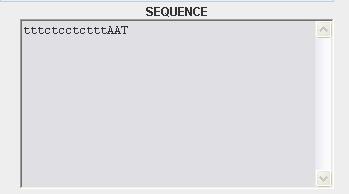
the SEQUENCE in a text area in which insert the sequence of the parts without space.
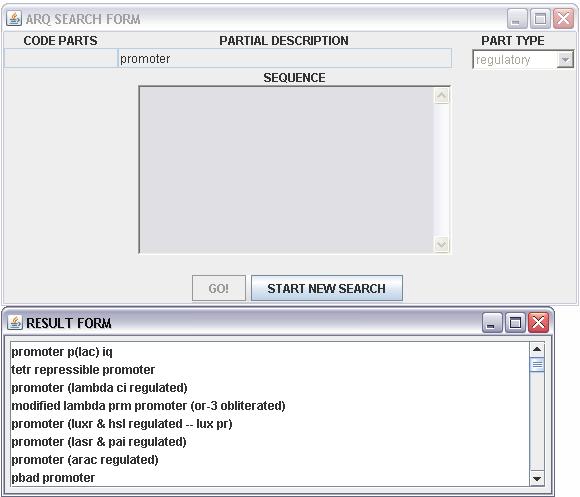
When we use the parameters partial description and sequence the search will not be unique so the
resutl will show in a new window teh result page:
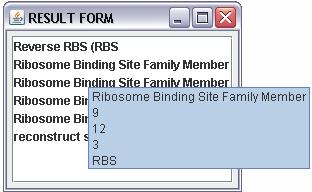
this page show a list of name of the registry parts and when we query the tools with a sequence is
possible through a tooltip to view in order :
- the name of the parts
- the first and the last index of the alignment between the query and the answer sequence
- the length of the answer sequence
- the group of the registry parts(regulatory,conjugation,signalling....)
When a part is selected, by a double mouse double click, the program automatically update the windows loading the empty fields with the part's data. The sequence field show the match between the parts changing to upper case the shared base.
 "
"
