Team:Bologna/Software
From 2008.igem.org
| HOME | TEAM | PROJECT | MODELING | WET-LAB | SOFTWARE | SUBMITTED PARTS | BIOSAFETY AND PROTOCOLS |
|---|
Image Acquisition and Analysis
Image Acquisition System
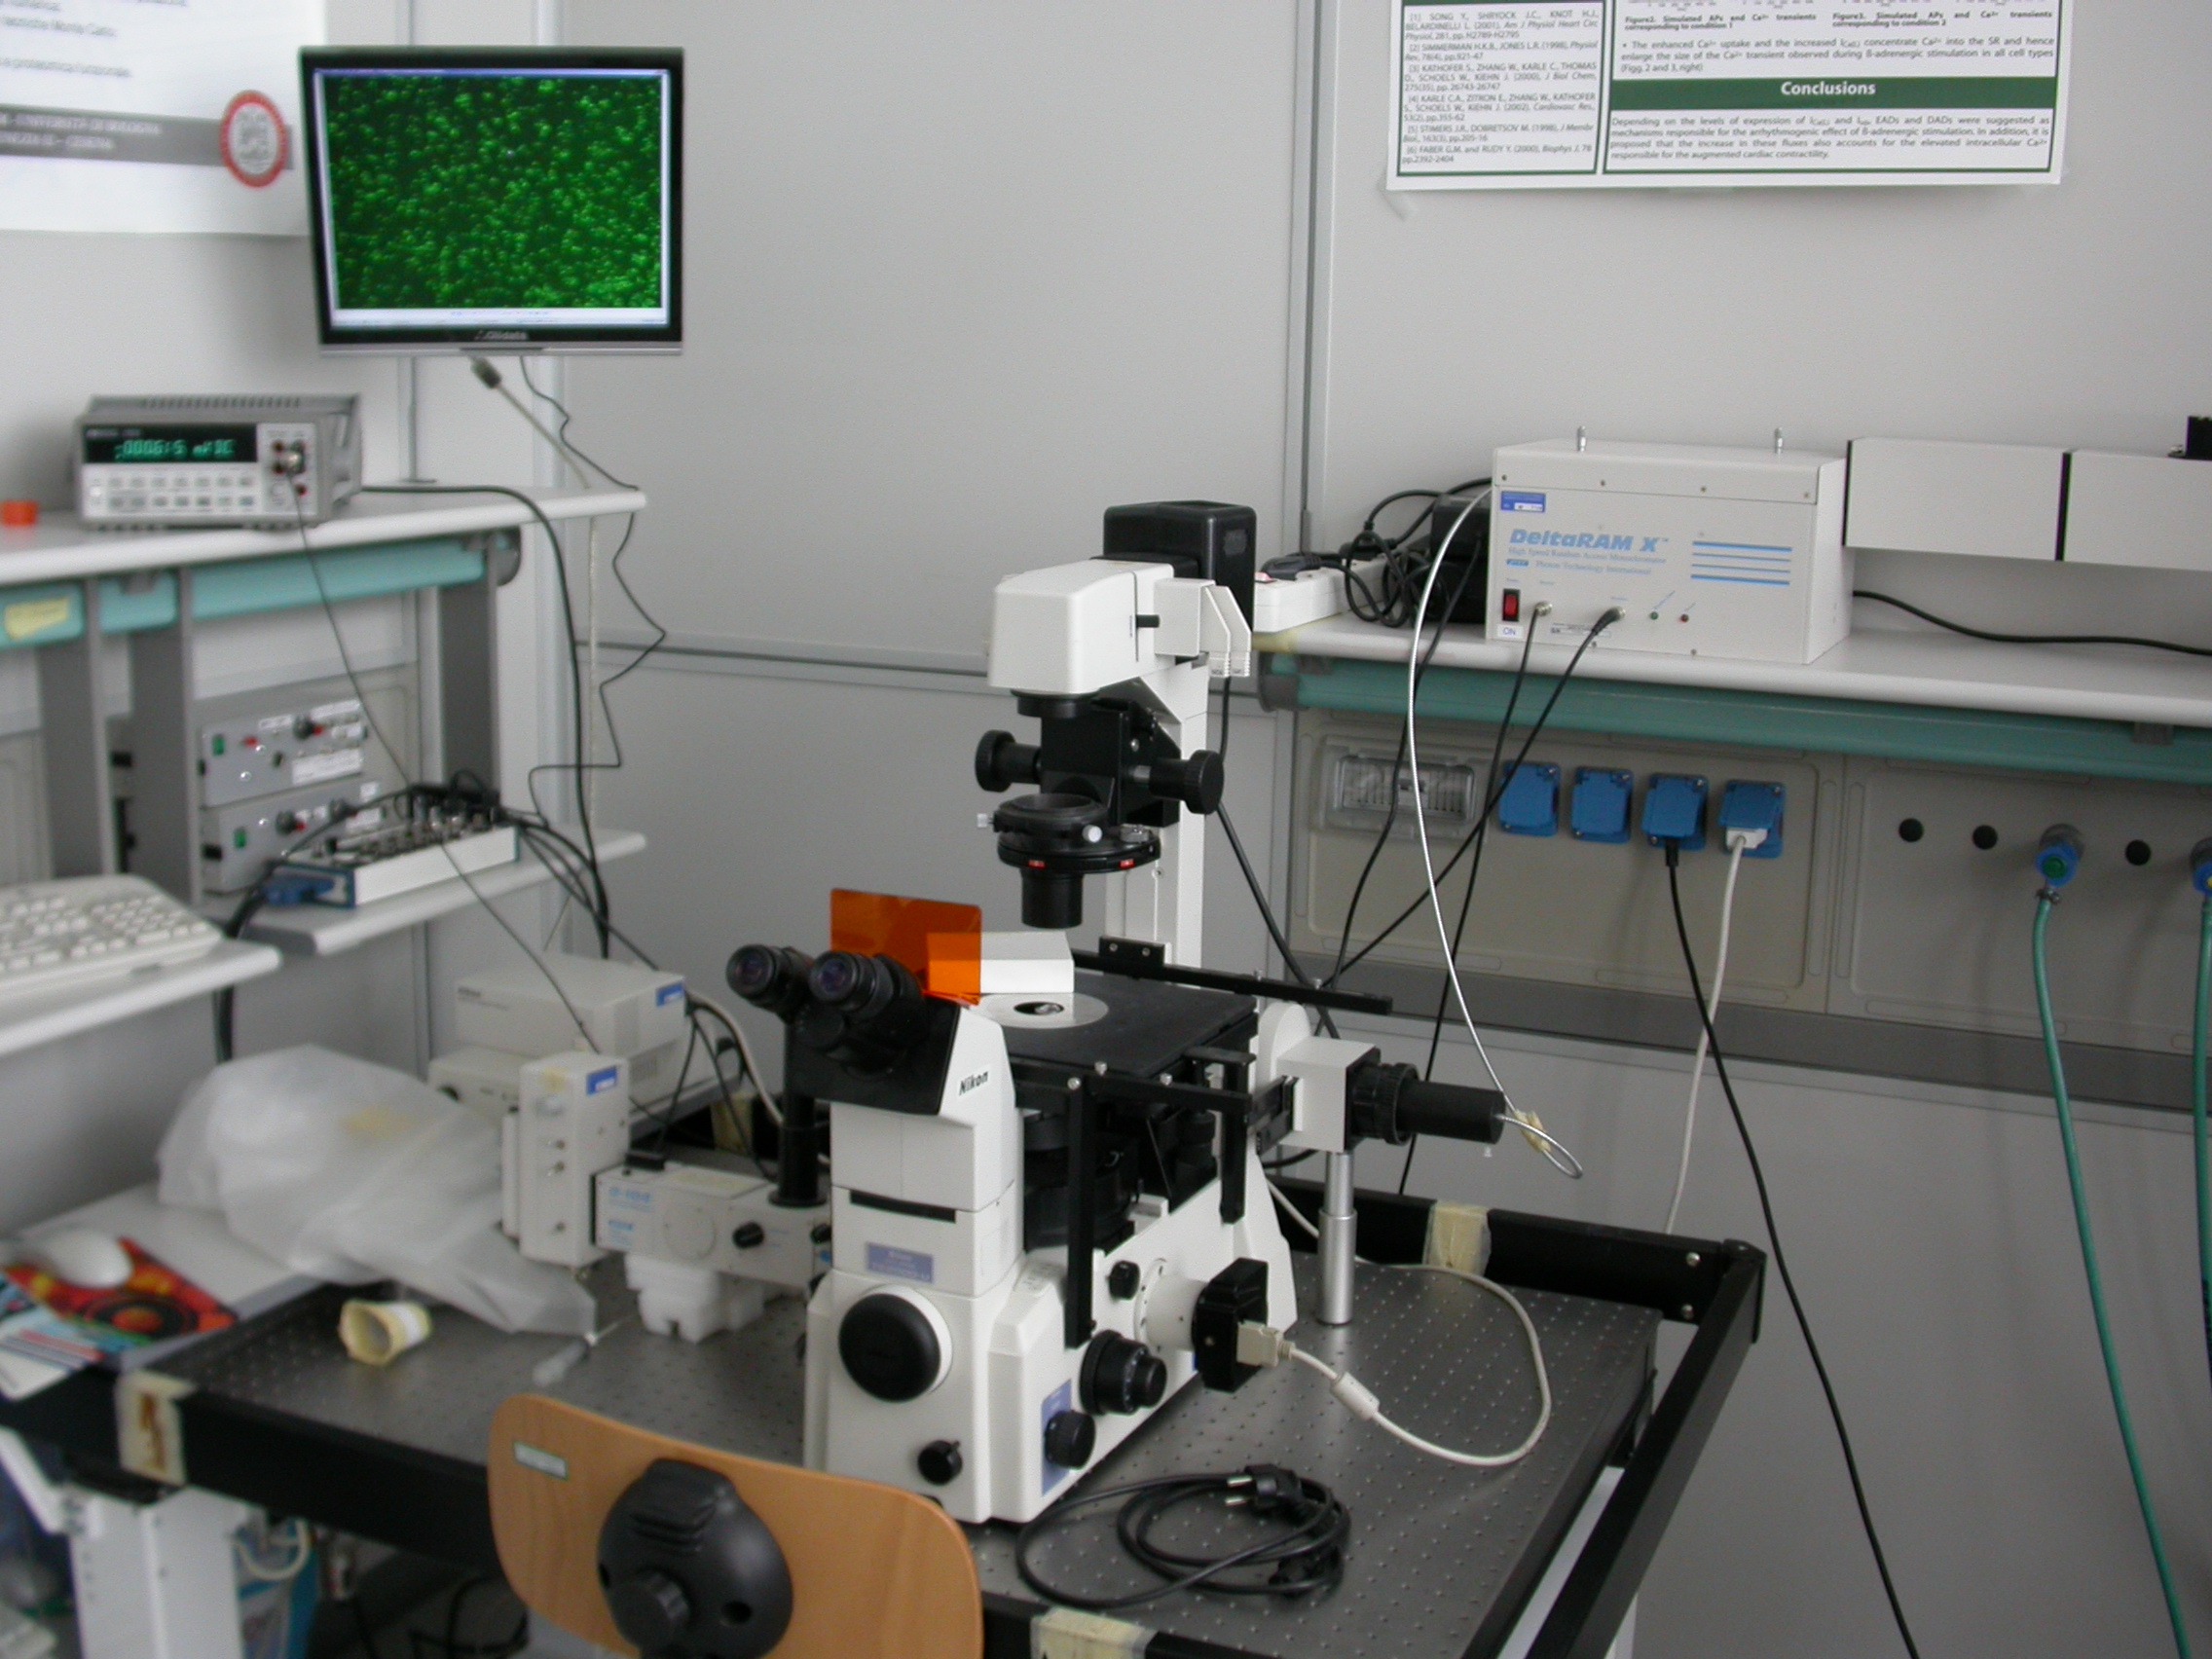
A schematic design of our acquisition system based on the fluorescence microscope is shown in figure.
The illumination system is composed of a 75 Watt Xenon arc lamp connected to a Photon Technology Instruments DeltaRAM X monochromator, which breaks up a single polychromatic light beam into several monochromatic light beams (with only one wavelength each). Only the selected wavelength can pass through the output port and reach the microscope.
The system’s core is a Nikon Eclipse TE2000-U inverted fluorescence microscope. For GFP image acquisition we used a B-2A filter by Nikon with an excitation band between 450 and 490 nm and the optimal emission placed at 520 nm.
The camera used to acquire images and film segments is a Nikon DS-5m with a DS-U1 controller. This one receives the acquired signal form the camera through a serial connection and sends it to the PC through an USB slot. Nikon also supplied an interface software for image acquisition and elaboration.
The Photon Technology Instruments PMT 814 photomultiplier tube is connected to the microscope’s left port, on which the whole light signal can be deviated. Acquisition can be implemented in two different modes, depending on the signal amplitude.
The control software is implemented in a Labview environment and permits the regulation of the excitation wavelength and the calibration of the system. It also pictures the output signal from the photomultiplier, which can be memorized and elaborated.
Visual Fluo Bacteria: a fluorescence image analisys software
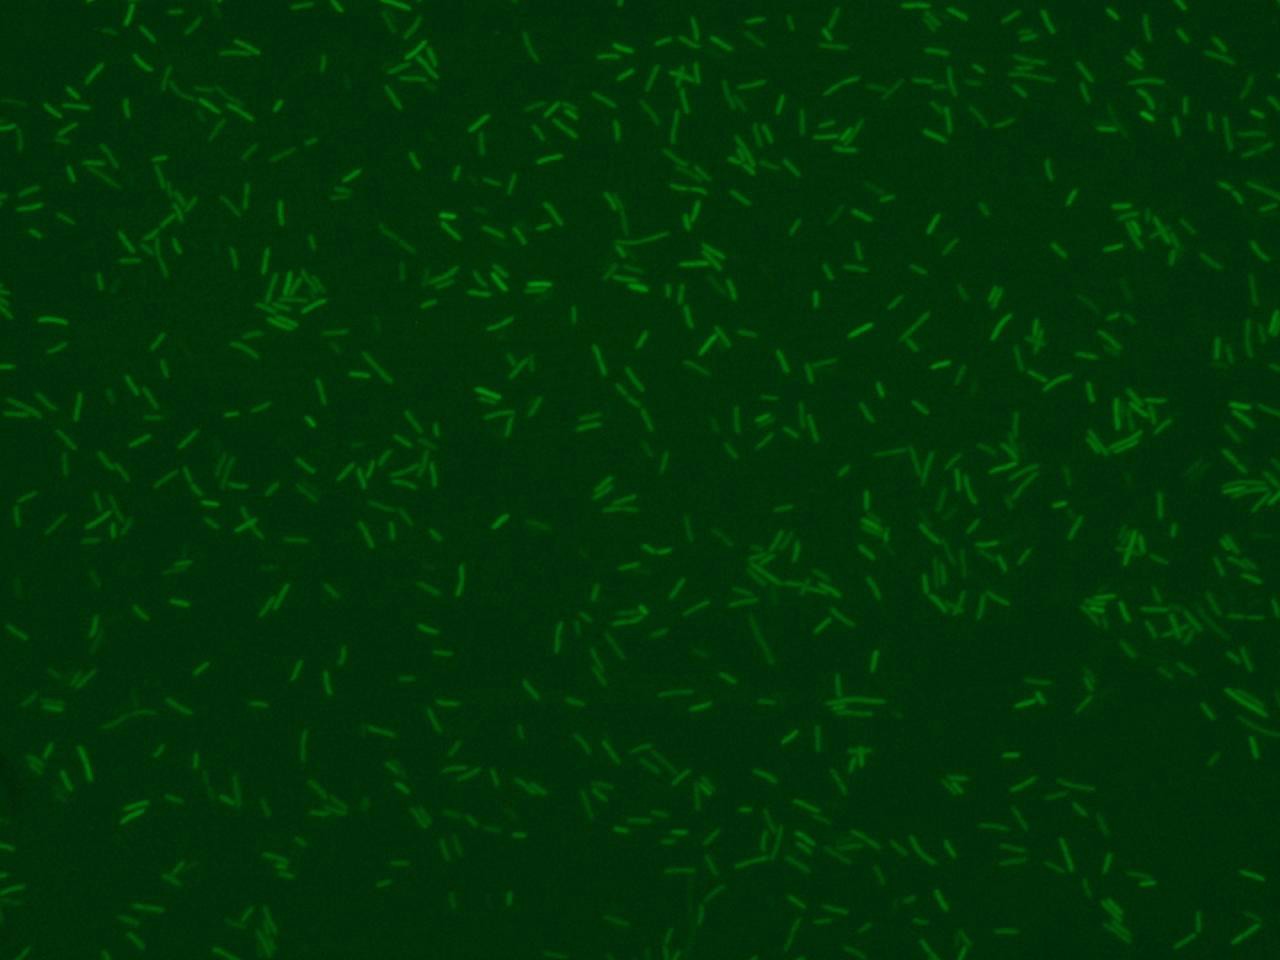
The activity of a promoter can be monitored using fluorescence protein as reporter inside bacteria plasmids and it is possible to detect the fluorescence trend through the time by software elaboration using picture with bacteria captured in fluorescence field.
Using microscopy observation we can integrate fluorescence data with bacteria’s morphology information and know the behavior of the single, that is impossible to detect by fluorimeter devices. In addition starting from fluorescence images we can have information about the dimension and the number of bacteria that express the fluorescence protein in a view.
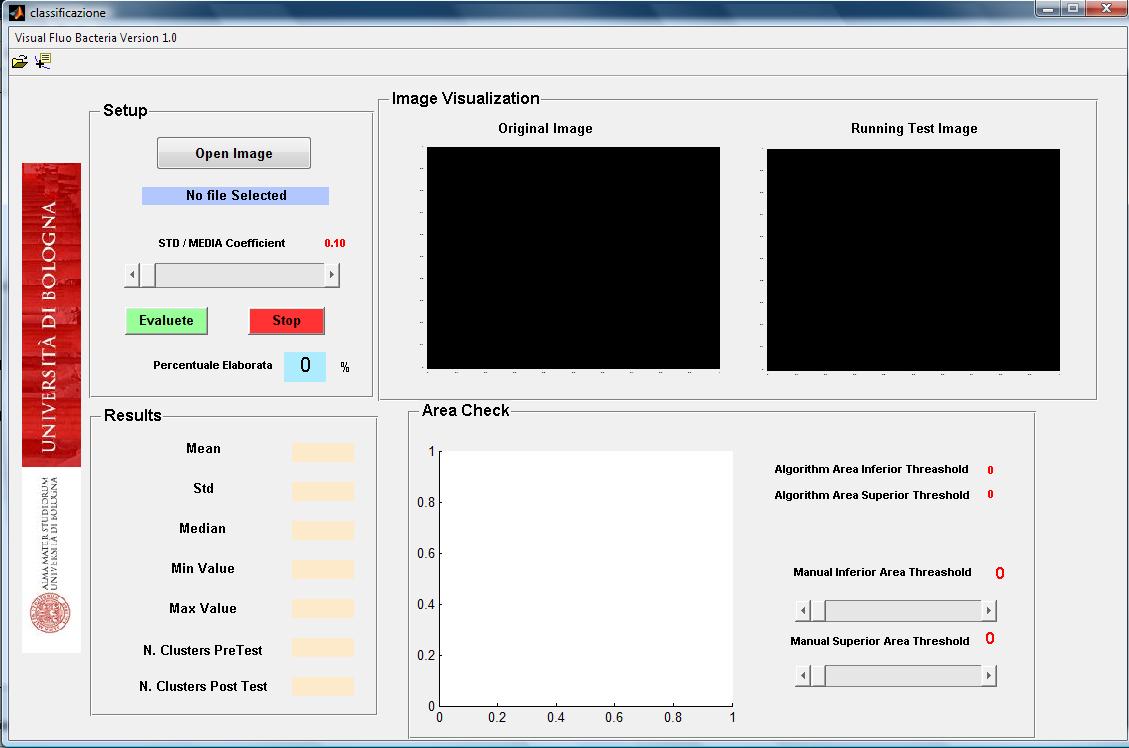
The implemented software is an easy and intuitive approach in order to have an idea about the dynamic of promoter activity in terms of mean of fluorescence per bacteria, standard deviation, maximal and minimal values for that.
The software has some parameters in order to setup correctly the analysis: the control of the area dimension of population selected and the possibility to discard those bacteria that have standard deviation and mean fluorescence ratio over a threshold. These two parameters are important in order to select always the bacteria population in the same physiological state and to discard clusters segmented as bacteria when in reality they are caused by detritus inside the view.
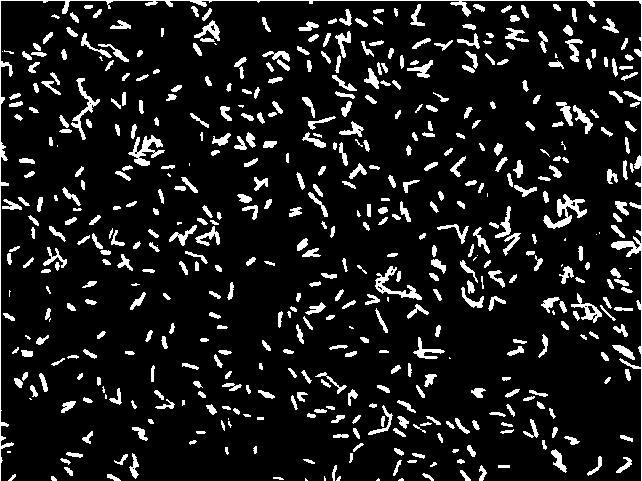
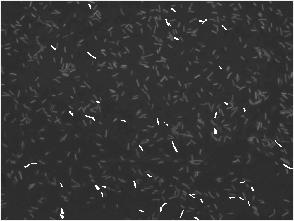
Illustrative example of analisys with very selective parameters (low ratio std/min and narrow range of area dimensions)

|
The ratio standard deviation / mean fluorescence referred for each bacteria is used to throw away during the final analysis the bacteria that lie on another focal layer and they aren’t focused correctly.
The algorithm reads fluorescence image and converts it in a black and white one that is filtered by Top Hat filter to correct uneven illumination when the background is dark. The following step is to compute the global threshold in order to convert an intensity image to a binary image using Otsu’s method. The image now is ready to be scanned pixel by pixel to detect clusters (bacteria) and obtain final information about their area, fluorescence mean (in RGB channel: R for RFP, G for GFP, B for CFP) and standard deviation. All the data are processed with area and focus efficiency parameters to estimate the mean, standard deviation, median, minimal and maximal fluorescence level of population selected.
By software is possible to check the original photos with “white colored bacteria” in order to know exactly from which bacteria the data are coming. </div>
To download the program and relative user manual, you can click on the following icons.
![]() Visual Fluo Bacteria 1.0
Visual Fluo Bacteria 1.0
Note: after decompacting file, execute and run classificazione.m
![]() User Manual
User Manual
 "
"
