|
(Under Construction : synchronisation and whole system)
Simulations and Mathematical analysis
Oscillations
Short System
- We wanted to see if, from a mathematical point of view, it was possible for the "short" system presented above to hover.
- Here are the equations we took into account :
- The equations are normalized (thus the degradation term set to 1), as well as the parameters :
| Parameters Used
|
| Parameter
| Normalized Value
|
| βFlhDC
| 1
|
| θFlhDC
| 0.2222
|
| n
| 2
|
| βFliA
| 0.1429
|
| β'FliA
| 0.8581
|
| βLasI
| 0.2222
|
| β'LasI
| 0.7778
|
- We decided to run simulations (see the corresponding codes) with different values of the parameters of the Hill function. Here are plot examples with pFlhB at first :
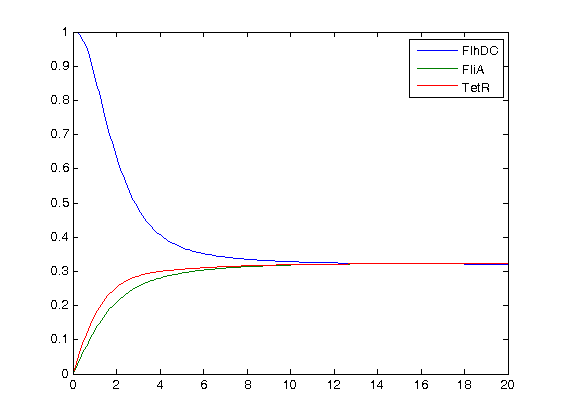 n=2 : no oscillations to be seen 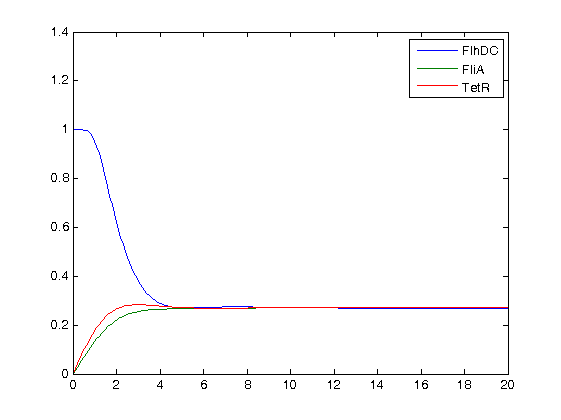 n=5 : some oscillations at the begining...  and some subdued oscillations when we zoom! 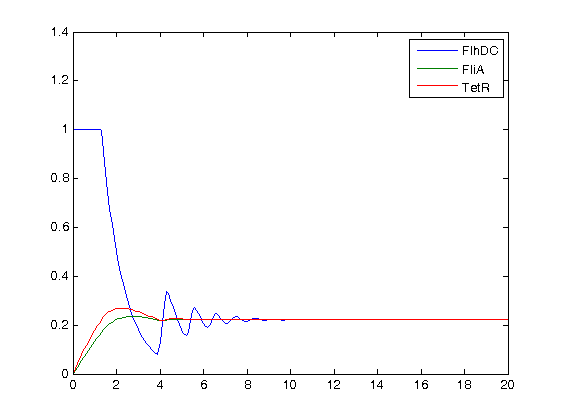 with a drastic (though non-biological) increase of n : n=300
- Then here are some plots with pFliL:
- What are the consequences of these observations?
- First of all, we may see that it is hard to get stable oscillations with this short system. However, depending on the time scale, and the concentration scale (since in our models, every concentration is normalized), it is possible to sustain oscillations for some period. We may see on the zoom of the plot where we considered pFlgB and n=5 that there are non-obvious but enduring oscillations of FlhDC.
- Then, we have understood that the Hill coefficient was in that case the key parameter. In fact, while trying to change other parameters, we did not improve the results. Yet, this is a key element as far as the wet-lab is concerned.
- Furthermore, one may see that FlhDC is the source oscillator, and that the other two are following. Then, we need to put the promoter which reaction to FlhDC is the strongest. Thus the choice of pFliL rather than pFlhB. The simulations above confirm this train of thought. Again, this is a key element to give to our wet-lab!
- Then we decided to undertake a mathematical approach, with the calculus of the Jacobian matrix, and the study of the eigenvalues. Here is the considered linearized system:
Hence the characteristic polynom :
We run simulations to evaluate the roots of this polynom, which nature would give us information on the quality of the equilibrium, and it confirmed our conclusions presented below.
- To conclude, these results that are seemingly "bad news" still give us important information. Indeed, we now know what gene to chose so as to give us the best chance to obtain oscillations. What we have proved is that the mathematical system won't stable provide oscillations with coherent parameters. However, we may assume that the real biological behavior will provide enough disruption to beget stable oscillations.
Whole System
(in construction)
- We wish here to conduct a full mathematical study on the whole system, with a Hopf bifurcation research. We intend to set most of the parameters and have some of them moving in a certain range. We wish to study the parameters set for which we the the eigenvalues cross the imaginary axis.
FIFO
- The goal here is to present the results of the simulations we made concerning the FIFO part of the system.
Here is the system we implementated using Matlab (see the corresponding codes)
and the corresponding equations (for more detailed information see our establishment of the model).
where CFP, YFP, and RFP will be denoted below as respectively Z1,Z2 and Z3.
- We wanted to see if our predictions were accurate or not. We then solved the equations, forcing the behavior of FhlDC. In a first step, we imposed a constant production term of 1. Then, at a certain time, we set this production term to zero :
In fact we assumed that this behavior for FlhDC was acceptable regarding its estimated behavior in the whole system.
- We saw previously that without FliA, the FIFO would presumably not work. We then simulated a first system, where [FliA] stays to zero value.
We may see that there is a LIFO behavior rather than the FIFO we expect...
- Then, we simulated the entire system, to check if we had
- the lasting burst due to FliA (more important for Z3 than for Z2, and more important for Z2 than Z1) in the increasing phase.
- the effect of fliA which maintained the concentrations to their maximum (more important for Z3 than for Z2, and more important for Z2 than Z1) in the decreasing phase.
- We observe on these plots that the behavior is quite the one we expected, and that the FIFO is realized. FliA enables the curves to cross, and adds a delay on the genes that are most affected, with gives a better observability of the FIFO behavior.
Synchronisation
(in construction)
Mathematical analysis
Simulmations and hypothesis verifications
simul plsrs cells//program
Etude maths//truc maths
si lasI constitutivement exprimé, il faut un delai > a eclui qu'on aurait sans diffusion HSL pour l'express de tetR
si HSL=0 et tetR exprimé=>no oscil
siHSL ext important il faut que tetR demaree qqsoit lasI
il faut que le pic d'hsl soit inférieur a la division cellulaire, car il faut que l'hsl ait le temps de s'accumuler
tetr doit réagir a un seuil important de hsl, sinon pokllution de la cellule par elle meme
|
 "
"


