Team:KULeuven/Model/FullModel
From 2008.igem.org
(Difference between revisions)
m (→Models) |
|||
| Line 47: | Line 47: | ||
** BUT you can see clearly that the ccdB (red curve) also peaks (to a value of 10 to 20 molecules) which is enough to result in cell death. | ** BUT you can see clearly that the ccdB (red curve) also peaks (to a value of 10 to 20 molecules) which is enough to result in cell death. | ||
| - | |||
| - | |||
== Full Model - Part 2 == | == Full Model - Part 2 == | ||
| - | |||
| - | |||
| - | Extension: self-inducable promotor for LuxR | + | === Extension to the previous model === |
| + | |||
| + | todo: Jonas --> self-inducable promotor for LuxR | ||
| + | |||
| + | === Describing the system === | ||
==== ODE's ==== | ==== ODE's ==== | ||
Revision as of 12:26, 27 August 2008
dock/undock dropdown
Contents |
Full Model
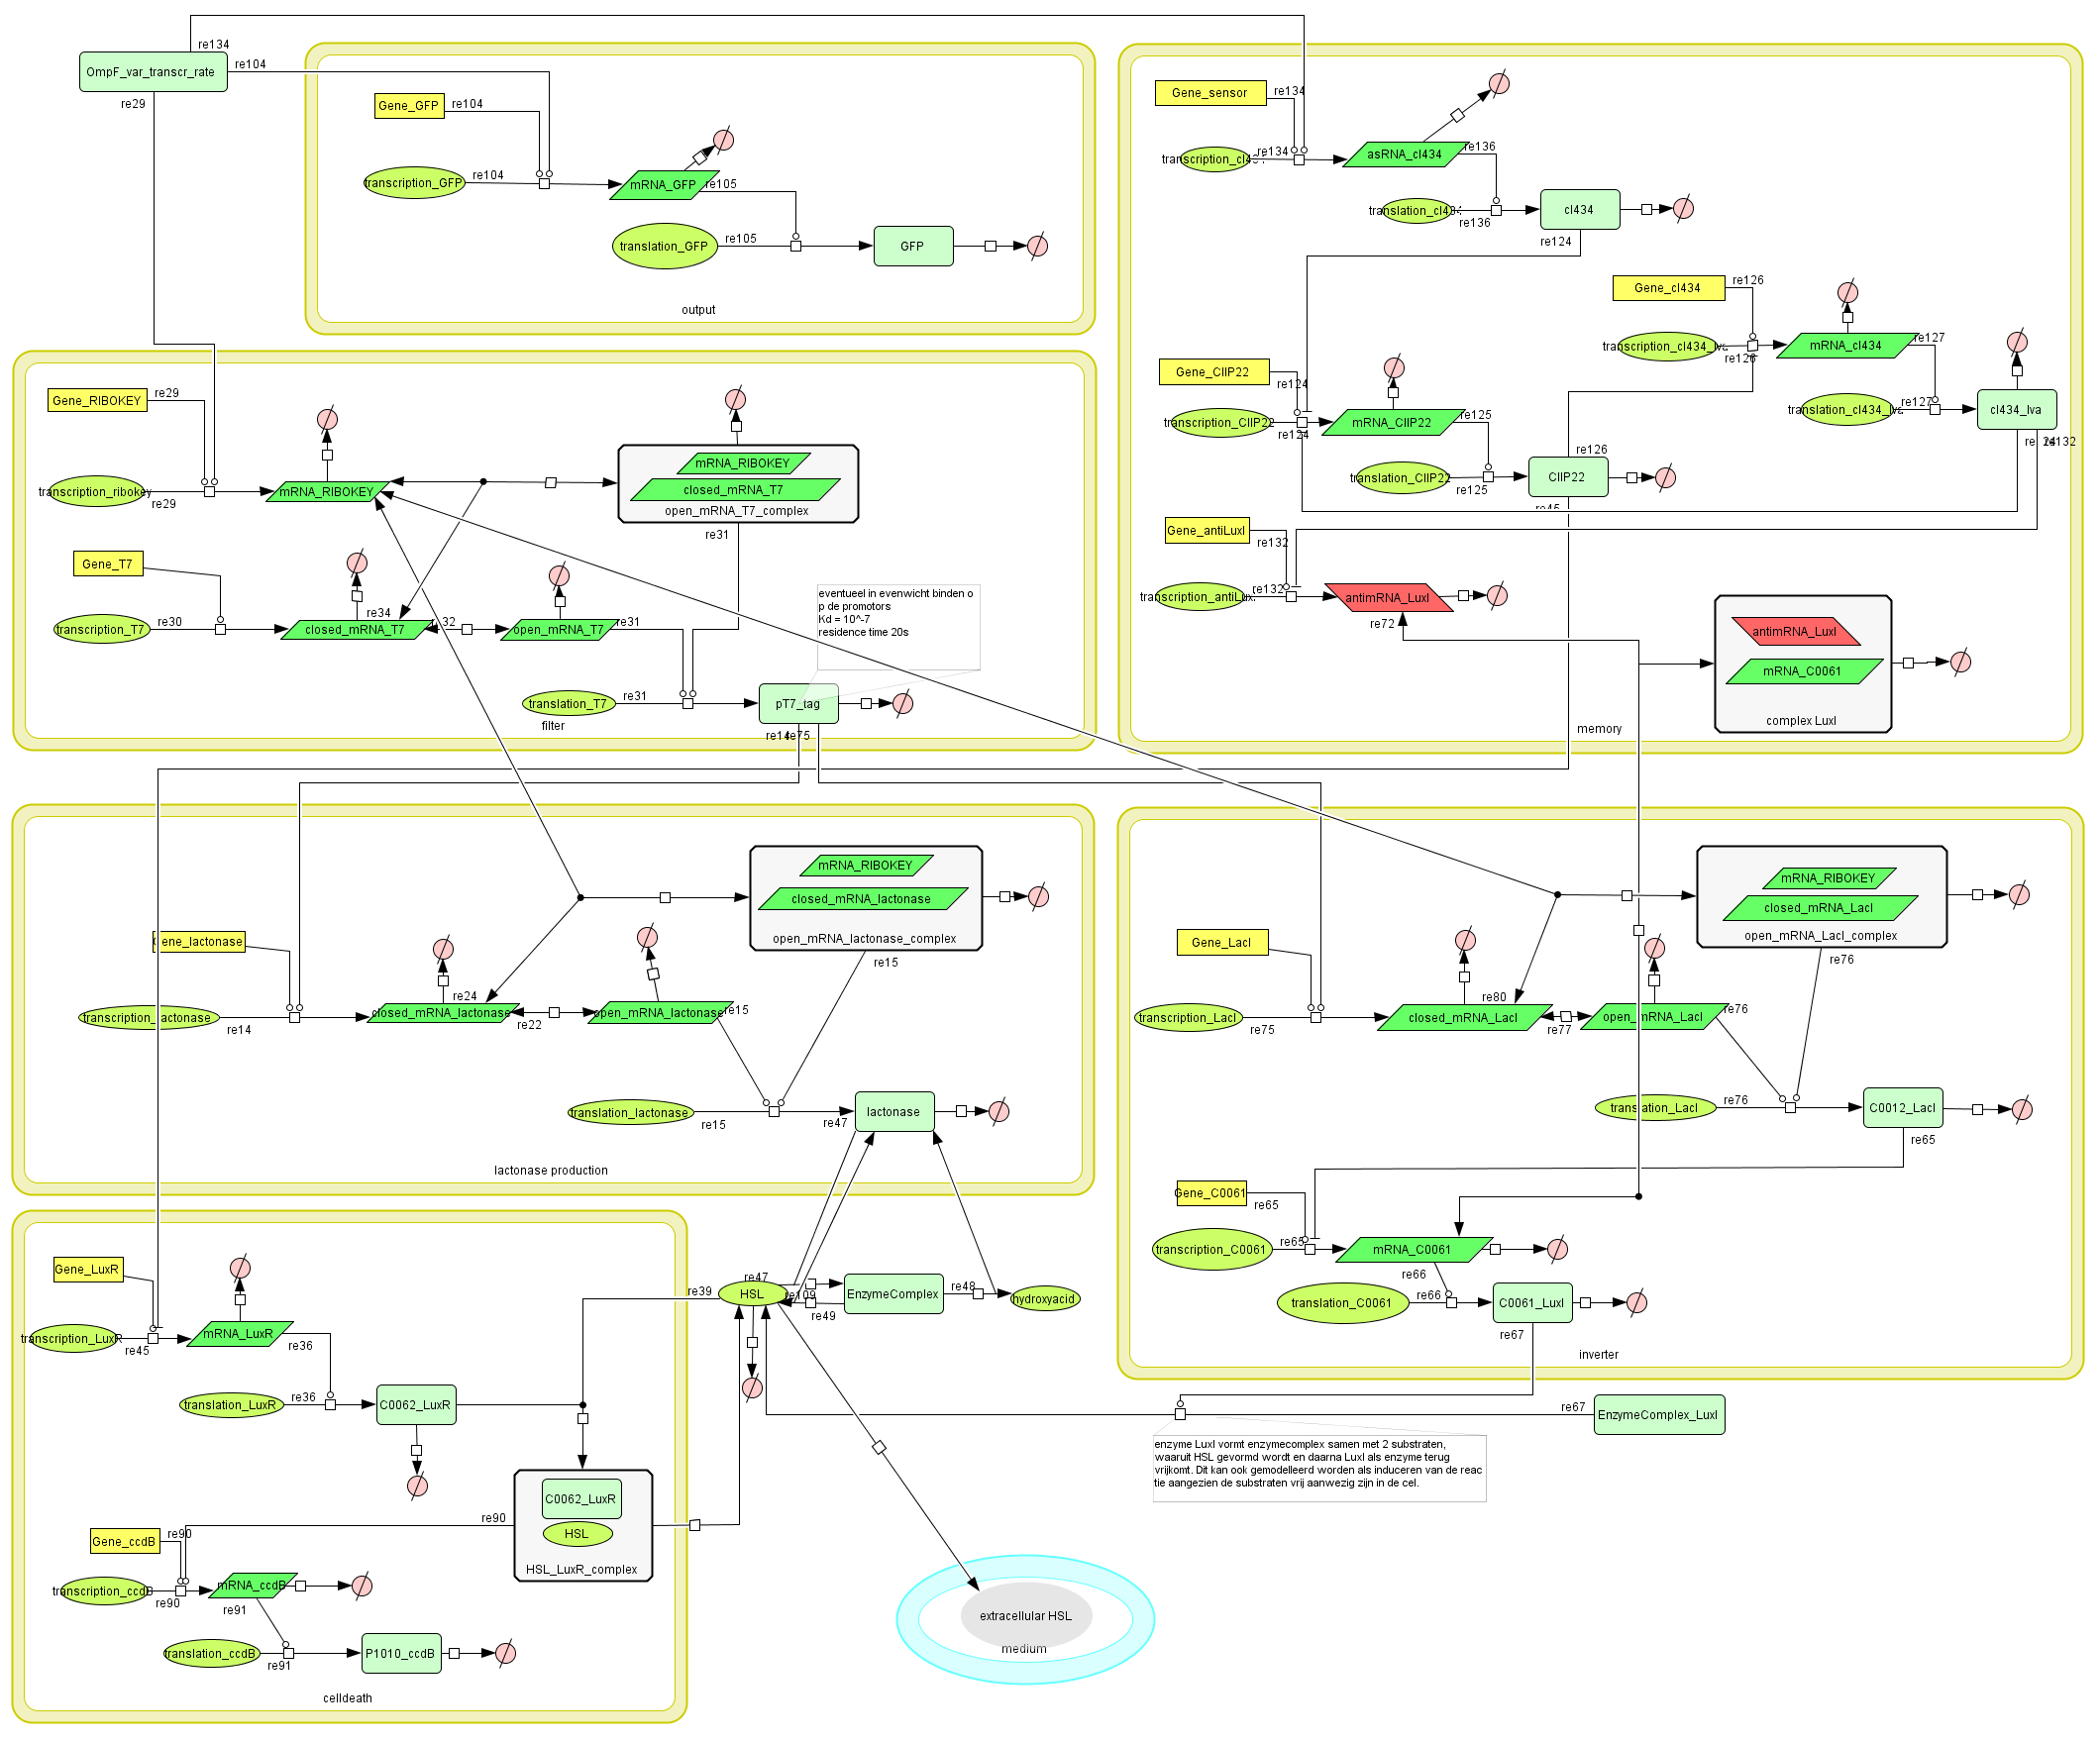
Describing the system
todo: describe the full functionality of the system
ODE's
Parameters
The parameters can be found in the sections about the simple parts of the system.
Models
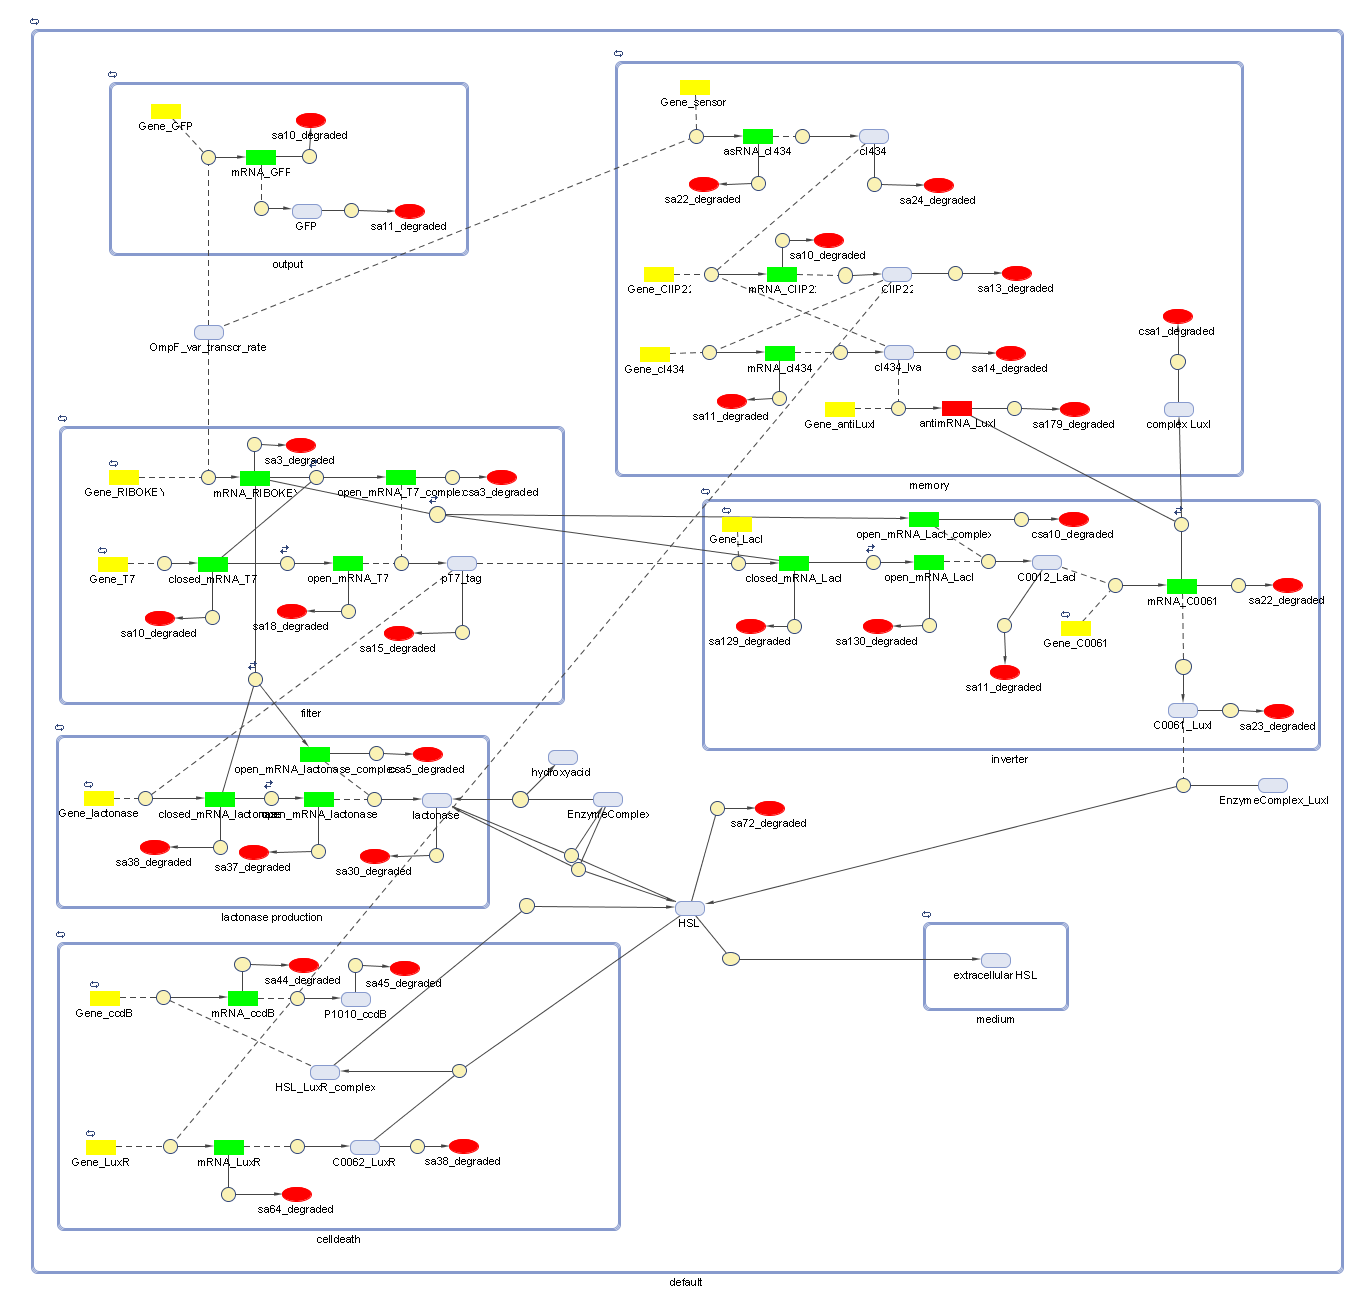
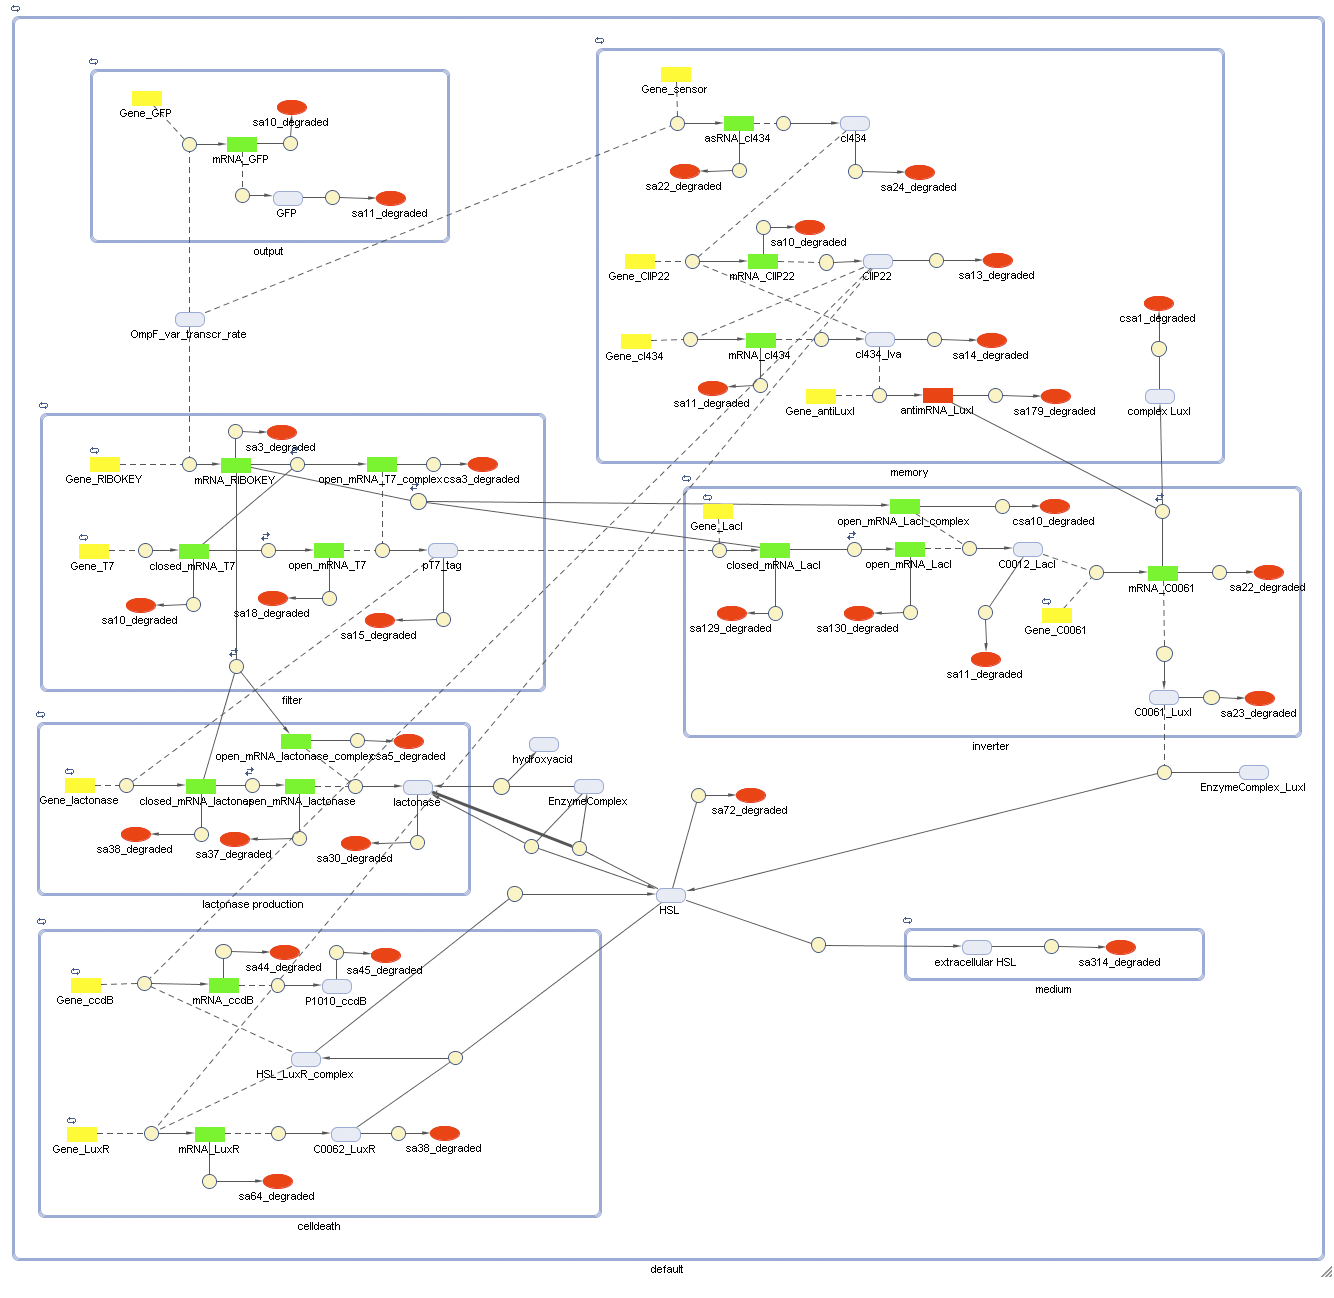
CellDesigner (SBML file)
Matlab (file)
Simulations
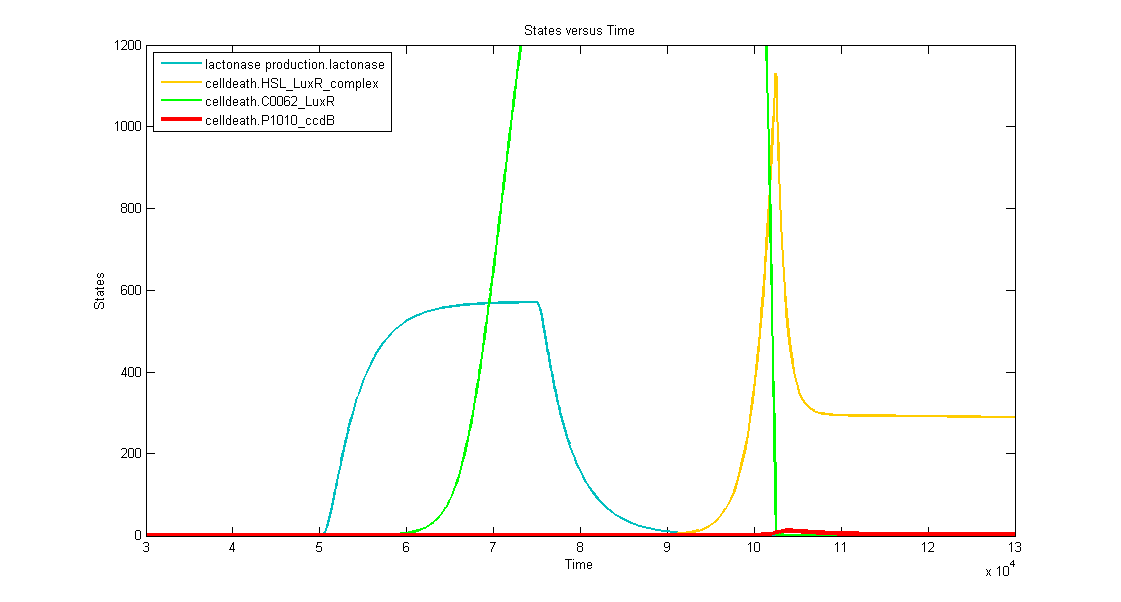
Discussion of the simulation:
- In the beginning the memory has status "0" and the simulation clearly shows that the timer isn't activated. This means that the bacteria can grow without any problem (no ccdB-production and hence no cell death) when they haven't sensed any desease marker in the beginning.
- At t=50.000s the system is activated by a long lightpulse (simulating the insertion of the bacteria in the patient's body and sensing desease marker for the first time). This results in:
- switching of the memory to status "1" --> activation of transcription of LuxR (green curve)
- activation of the filter (desease marker is strong enough) which is reflected by the production of lactonase (blue curve), situated just after the filter mechanism.
- At t=75.000 the lightpulse is switched of (simulating that there's no more desease marker: the patient is cured). This results in:
- stopping the production of lactonase, which starts to degrade naturally (blue curve)
- stopping the production of LacI, which stops repressing the transcription of LuxI. In this way HSL can be produced, but, since there's still lactonase present in the cell, there won't be a visible increase in HSL-LuxR-complex because the HSL is being transformed into hydroxyacid.
- At t~=92.000 the lactonase is almost totally degraded which enables the HSL to form a complex with LuxR (yellow curve). This means that we have a timer that starts with a delay of +- 17.000s. At this point the HSL-LuxR-complex really starts to build up gradually (TIMER) for about 10.000s.
- At t~=102.000s the HSL-LuxR-complex peaks, with at the same time (free) LuxR decreasing to almost zero.
- At this point all the newly produced LuxR will go into complex with HSL and no free LuxR will remain. From this point on, the HSL-LuxR-complex will decrease to a steady state value which is equal to the production rate of LuxR-proteins.
- BUT you can see clearly that the ccdB (red curve) also peaks (to a value of 10 to 20 molecules) which is enough to result in cell death.
Full Model - Part 2
Extension to the previous model
todo: Jonas --> self-inducable promotor for LuxR
Describing the system
ODE's
Parameters
The parameters can be found in the sections about the simple parts of the system.
Extension: self-inducable promotor for LuxR
 "
"


