Team:TUDelft/Temperature software
From 2008.igem.org
Contents |
Software
This chapter describes two software tools that have been developed during the project. Both tools are written in [http://java.sun.com/javase/6/docs/api/ Java (6)] using [http://www.eclipse.org/ Eclipse] as software development tool. Both software tools, including the source code, can be downloaded at the downloads section.
The first section is devoted to the RNA Hairpin Designer, a software tool that designs the sequences of RNA hairpins with a specific stability profile. This tool can be used to automatically design sequences of temperature sensitive hairpins with a defined theoretical switching temperature.
The second section is devoted to the Stability Profile Plotter, a software tool that transforms the output data from RNAeval - a program that provides textual information about the distribution of free energy within a secondary structure - into a plot. This tool can be used to plot the stability profile of an RNA hairpin structure.
RNA Hairpin Designer
The RNA hairpin designer is a software tool that designs RNA sequences that will form a hairpin structure with a given stability profile. This way, a temperature sensitive hairpin can be designed automatically. The tool has been made to show how the algorithm, as described in the second design phase, can be implemented efficiently. It has been developed at the end of the project and has therefore not been used for the design of new BioBrick Standard Biological Parts. At the moment this would also not be possible, because the algorithm has not been fully implemented yet. The current implementation is only able to design a hairpin structure with a double helix that does not contain any bulge or internal loops. Also the algorithm is only able to design a hairpin with a given stability profile at 37°C. If we would like to design a hairpin with a different switching temperature, using the method specified in the second design phase, then it should also be possible to design a hairpin with a given stability profile at a different temperature.
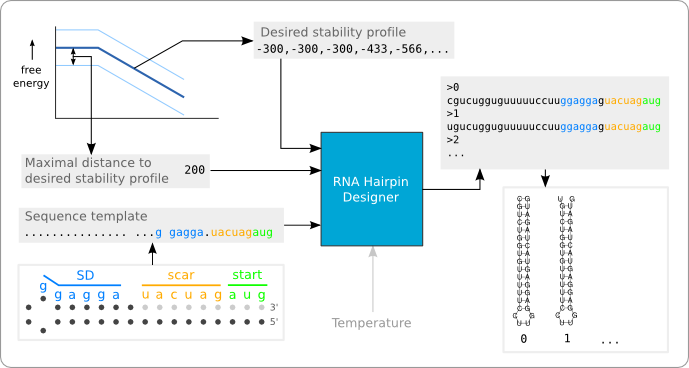
Figure 1 shows a black box representation of the software tool. In the current implementation there are three inputs (the black arrows entering the black box): A string that provides the sequence template, a list of integer that represent the desired stability profile, and an integer that defines the distance of the boundary to the stability profile. The grey arrow shows the input of a desired temperature, which has not yet been implemented. The software tool provides as output a list of RNA hairpin sequences that fit the stability profile and match the given template.
Efficient method
An inefficient method to design a temperature sensitive hairpin is given in second design phase. Such a method could be implemented using a brute force algorithm. It will first be shown why this approach will not work and after that a more efficient method will be discussed.
Brute force
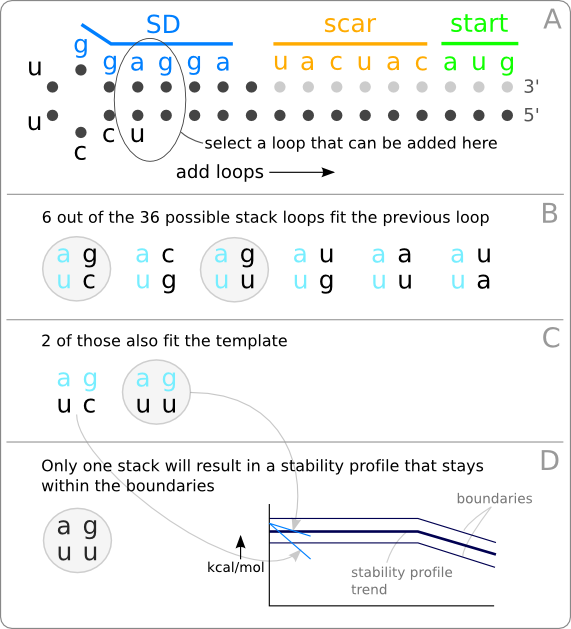
Taking each possible sequence and see if it meets the requirements as stated in the design requirements would be the most simple solution. Given the template in figure 2A there are nineteen nucleotides which are free to choose. With four options per nucleotide this gives 419, which is over 250 billion possible sequences. When the evaluation of one possible sequence would take 1ms, it would take almost nine years to evaluate each possible sequence. Although it is a simple solution, it is not very efficient. Only a very small amount of the total number of possible sequences will meet the stated requirements, so the search time needed to find these sequences will be much to long.
Iteratively adding loops
Instead of focussing on the nucleotide sequence, it would be wiser to focus on the free energies within the resulting structure, which determine the stability profile. Because in the end, this is what we are interested in; the goal is to have a stability profile that fits a given trend line (figure 8 of the analysis).
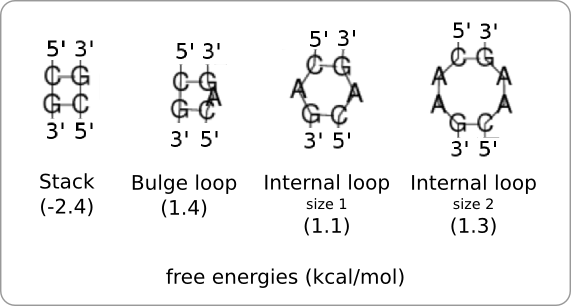
The idea is to build a hairpin structure through iterative addition of loops from left to right, starting from the hairpin loop (figure 2A). There are different kind of loops that can be added at each step and each kind of loop has its own specific amount of free energy (figure 3). Before a loop can be added to the end of the stack, it has to be determined if 1. the loop fits the previous loop (figure 2B), 2. the loop fits the given template (figure 2C), and 3. the stability profile, after addition of the free energy of this loop, stays within the given boundaries (figure 2D).
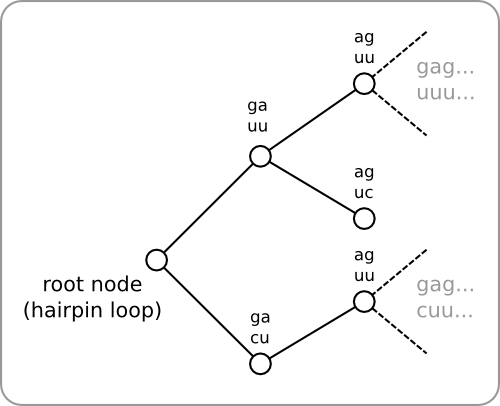
At each step, more than one loop could meet the three requirements, but there is no way of telling which of these would be the best choice. So instead of choosing one of the loops, they will all be added to a hairpin. This way, multiple hairpins are being build in parallel. Within the software this has been implemented as a tree, with the hairpin loop as the root of the tree (figure 4). A tree is then build as follows. All loops that meet the three given requirement are added as child nodes to the root. Next, the same procedure is executed for each of the added child nodes, and so on. This way the tree can be build up recursively. At the end, each branch within the tree represents a hairpin. Backtracking can then be used to retrieve the sequences of the resulting hairpins.
Implementation
As already mentioned at the beginning of this section, the implementation of the algorithm is limited. It is not able to insert bulges and internal loops within the double helix region of the hairpin structure. Also the temperature is still fixed to 37°C so that we are only able to fit the stability profile of the hairpin to the trend line at 37°C. In other words, it is only able to design 37°C switches.
Class diagram
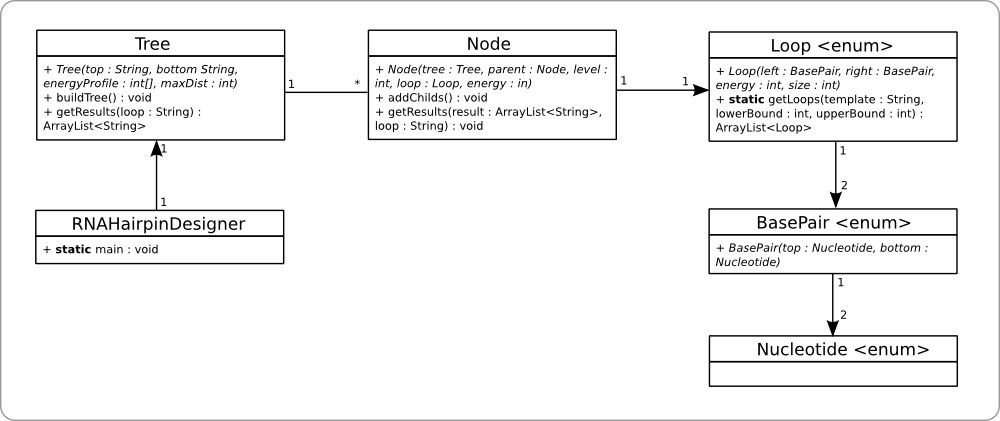
There are six classes as depicted in figure 5 of which the RNAHairpinDesigner class contains the main method. This class also contains all the code for the Graphical User Interface.
The Tree and Node class are used to build up the tree and retrieve the results from it in a recursive way. The buildTree method builds up the tree by calling the recursive addChilds method of the root node. Likewise, the results are retrieved by calling the getResults method of the Tree class, which on its turn calls the recursive getResults method of the Node class.
There are three enumeration classes, Loop, BasePair, and Nucleotide. There are four nucleotides specified (a,u,g,c) and six base pairs, each consisting of two nucleotides (au, ua, cg, gc, gu, ug). The loops specify a left and a right base pair, because bulge and internal loops are not implemented yet, there cannot be anything in between these two base pairs. So at the moment there are 36 (6 x 6 base pairs) different loops specified, each with their own free energy.
The getLoops method is used by Node's addChilds method in order to determine which loops can be added as a child of this node (figure 2). The addChilds method builds a template string based on the loop of it's parent node and the template of the overall hairpin, and determines what the minimum and maximum energy of the loop might be without crossing the boundaries of the trend line. This template string and upper and lower energy bound are handed over to the getLoops method, which returns all the loops that match the given template and have a free energy within the given boundaries. All the returned loops can then be added as a child to the current node, because they all meet the three requirements as stated in the previous section. The same method can then by applied to all the just added child's.
Graphical User Interface
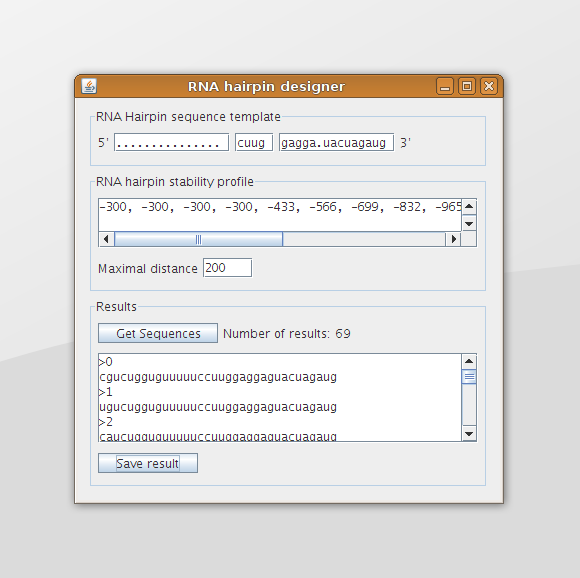
The Graphical User Interface is shown in figure 6. At the top of the screen the template can be provided in which the dots indicate that any nucleotide may be used at that location. The text field in the middle contains the sequence of the hairpin loop and the leftmost and rightmost text field contain the sequences that are part of the double helix region. These two sequences should have the same length.
Note that the software tool never really checks if the designed sequence will actually form a hairpin structure. When, for example, the user would enter two very short double helix sequences and a very long hairpin loop sequence, then the designed hairpins will probably fold into a different structure. In this case there is a big chance that the short helix regions will interact with long hairpin loop region. In such a case it might be necessary to use a program like RNAfold to check whether the designed sequences really folds into the desired hairpin structure.
The user can specify the desired stability profile in the box in the middle of the screen. This can be done by specifying the free energy at each step (the y-value at each x-coordinate of a stability profile plot) in the form of a comma separated list. In figure 6 the (beginning of the) stability profile trend, as shown in figure 8 of the analysis, is given in the text area. The maximal distance text field can be used to specify the maximal y-distance that is allowed at each x-coordinate between the desired stability profile and the stability profile of the designed sequence.
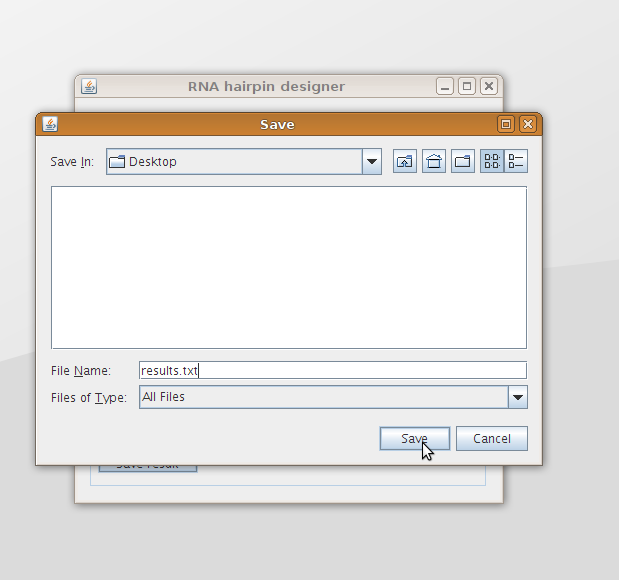
The box at the bottom shows the results after pushing the Get results button. These results can be saved to file using the Save results button (figure 7). The output is given in such a format that it can be used by the RNAfold program without adjustments.
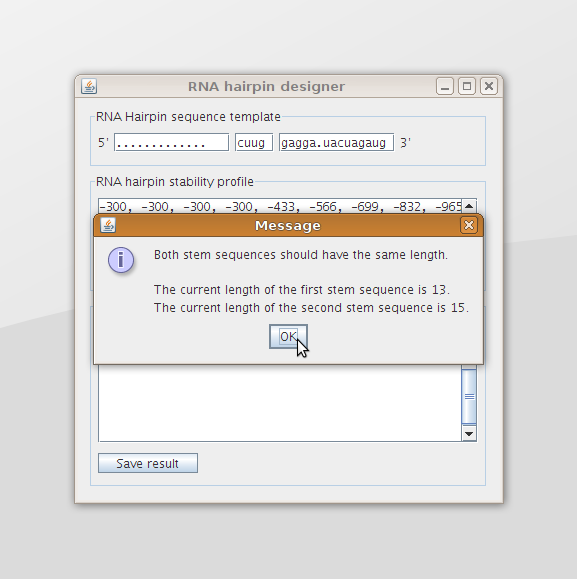
The program will also provide the user with a message when he provides incorrect input data (figure 8).
Results
When we run the program with the trend as given in figure 8 of the analysis, the template as given in figure 3 of the second design phase, and a maximal distance to the trend line of 200 (which is +/- 2.0 kcal/mol), this will result in 69 designed RNA sequences (the same situation as displayed in figure 1 and figure 6). The stability profiles of all these hairpins are plotted using the Stability Profile Plotter, a software tool which is described in the next section. The result is shown in figure 9, in which the light blue lines are the stability profiles of the 69 hairpins that stay within the boundaries (dark blue lines). When these boundaries are set to infinity there are 1536 resulting hairpin designs, which are plotted in light grey. Note that this are only hairpins that containing only stack loops within the double helix part of the hairpin.
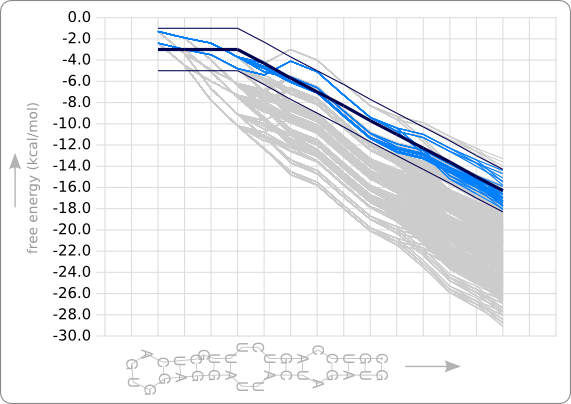
As can be seen in figure 9, the designed hairpins stay within the given boundaries but do not really fit the given trend line (the dark blue line) at the beginning. This result shows that an extra requirement is needed to get a better fit of the stability profiles to the trend.
The data in figure 8 of the analysis shows that it is not reasonable to fit the stability profile as much as possible; the data lines do follow a certain trend but there is quit some fluctuation in these lines. That's why it has been chosen to set boundaries at a certain distance from the trend line. Better fitting to the beginning of the trend line could be achieved by stating that the average slope should be close to zero in the first three steps, which is the slope of the trend line in that region. Applying such a requirement would probably decrease the number of results drastically, in case of this example the number of results will drop to zero, since the free energies only decrease in the leftmost region. But since it is expected that there will be a lot more resulting designs when bulges and internal loops can also be incorporated within the double helix region, this is not a problem anymore. There will probably still be a lot of hairpins that meet all the requirements.
Stability Profile Plotter
The Stability Profile Plotter is a software tool that plots the free energy data that RNAeval provides as result. A template Standard Vector Graphic (svg) file, containing the grid, must be provided to the tool, which will then add the plot to this grid. Automatic production of a grid would be a nice improvement of this tool.
Class diagram
The class diagram of the Stability Profile Plotter is shown in figure 10, in which only the most important methods are given. The StabilityProfilePlotter class contains the main method and all the GUI code. It uses the Plotter class to read the input file, containing the free energy data as produced by RNAeval, and the template file, which are then used to produce the output svg file containing the plot. The Plotter class uses the Hairpin class to store the data of a single hairpin and a Hairpin consists of a number of Loop objects.
Graphical User Interface
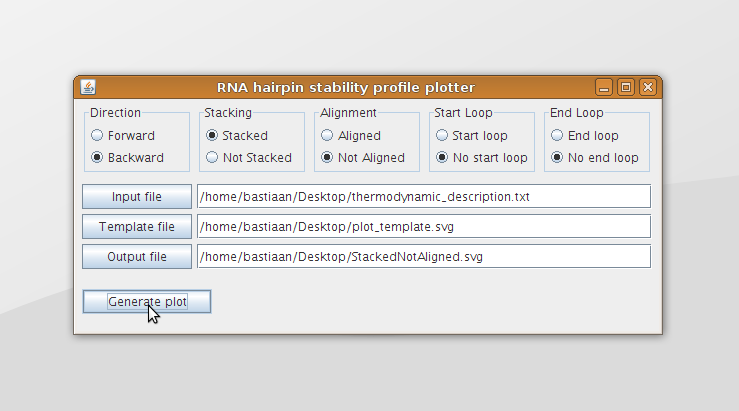
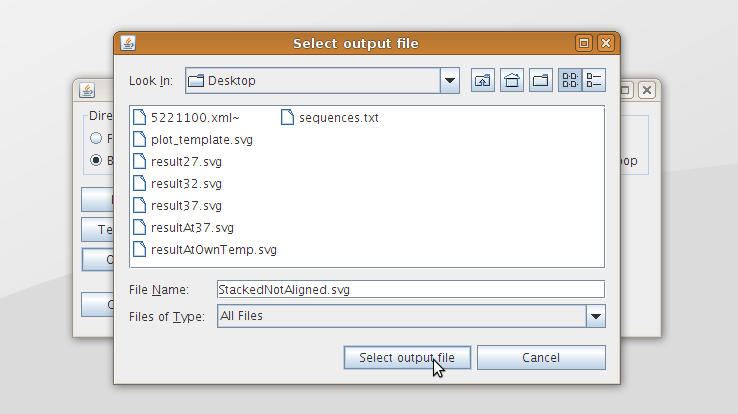
The Graphical User Interface (GUI) is shown in figure 11. The radio buttons at the top can be used to specify how the data should be plotted. These different ways of plotting the data are discussed in section data analysis and can also be seen in figure 7 of the analysis. The input and output files can be specified in the text fields below. Also buttons are provided to browse to the desired input or output file (figure 12). The Generate plot button can be used to generate the output svg file.
Note that this tool can only be used to plot the free energy distribution within a hairpin structure. It expects an input file (generated by RNAeval) that contains the energy distribution of a hairpin structure. Providing input of a different structure will not provide any useful output.
 "
"
