Team:TUDelft/Color modeling
From 2008.igem.org
>> work in progress
Contents |
Color Modeling
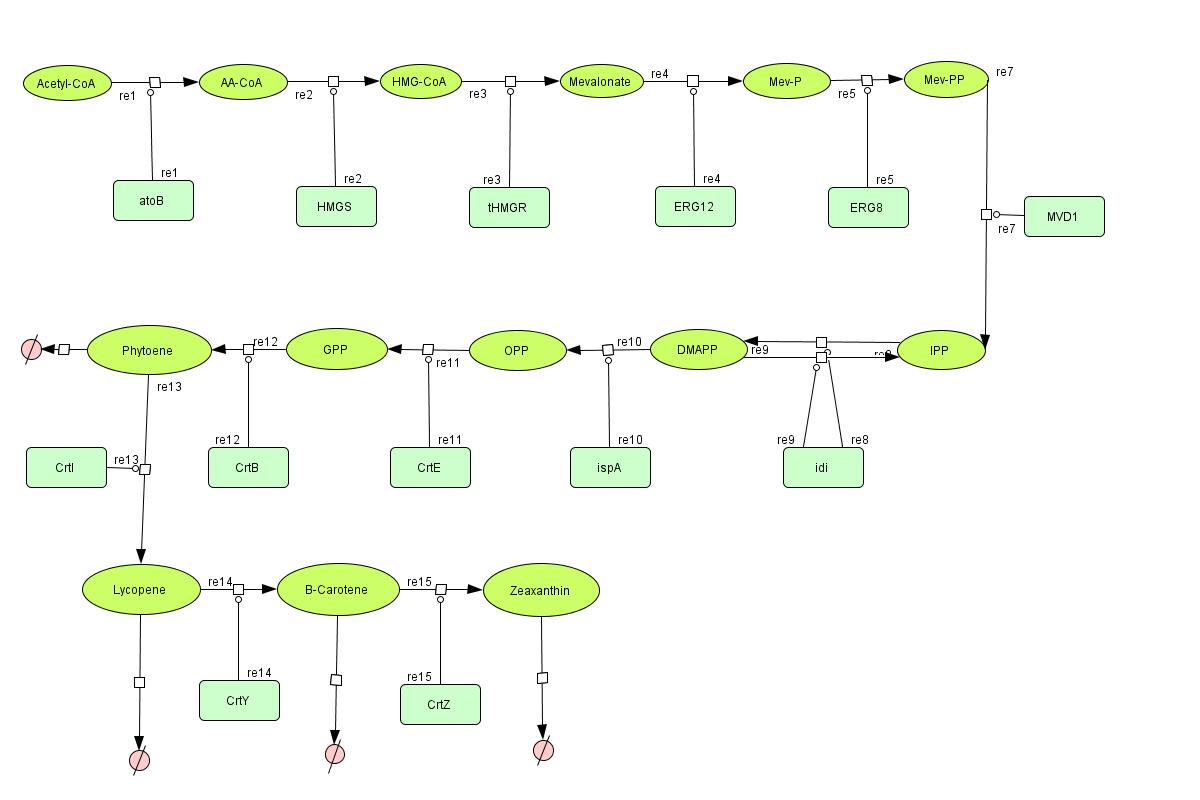
In the output we use [http://www.lbl.gov/Science-Articles/Archive/assets/images/2004/Mar-24/Engineering_terpenoids.pdf mevalonate] and [http://parts.mit.edu/igem07/index.php/Image:Zeaxanthin.jpg GPP] pathways together to produce red, orange and yellow colors. The biosynthetic model is built in CellDesigner™. There are 14 substrates and 13 enzymes in total. The first substrate is Acetyl-CoA which is provided to the pathway in a constant level. The last three substrates are the color products and are consuming so we have degradation links for them. Lycopene, B-carotene and Zeaxanthin give red, orange and yellow colors respectively.
Differential Equations
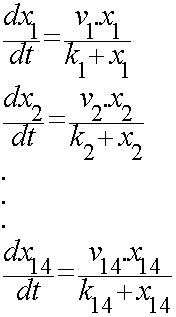
For the 14 reactions of enzyme-substrate the Michaelis-Menten kinetics is applied and we have the mass action kinetics for the three degradations. According to the kinetic laws there are 14 differential equations for enzyme-substrate reactions and three for degradations which could be constructed as:
x1 to x14 are the subtrates.
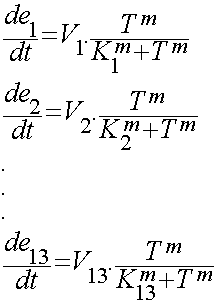
We used hill type model for enzyme temperature relations where e1 to e13 are the enzymes. Afterwards the in CellDesigner™ file was imported into Matlab. For this procedure many softwares were tested but finally the [http://www.sys-bio.org synthetic biology workbench] site used to convert the SBML model into m file. This m file was the base part for the modeling in Matlab. In this m file all the related differential equations were defined as a function with the time span and initial condition as the input. The reactions coefficients are defined by some not systemically acquired numbers to give an estimation for the reactions. These differential equations were solved by Matlab ODE function. Due to the weaknesses in CellDesigner for defining the SBML file the converted file had many problems. To solve these problems the m file was modified.
Initial solution for ODEs
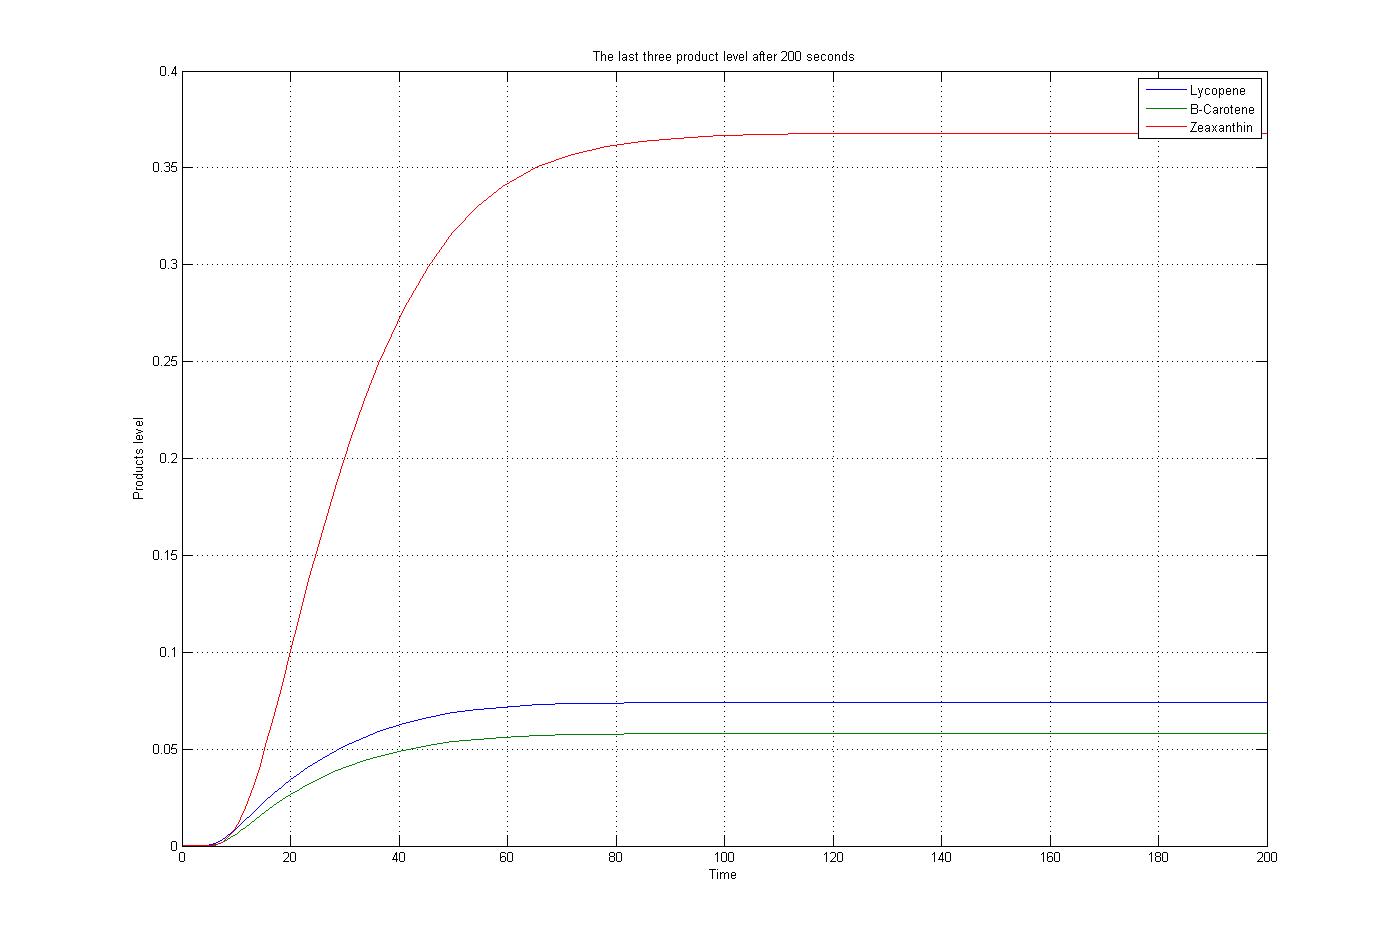
The m file function, as mentioned before, was solved by the ode15s function of Matlab. To do this procedure some assumption was used. The first substrate, Acetyl-CoA, assumed to produced and consumed with the same ratio. Also for simplification the level of enzymes assumed to be constant. The reaction coefficients are defined the same for all reaction with some non-accurate numbers to give an overview about the reactions. The results for these assumptions and specific boundary condition and time span of 200 seconds were plotted. These results show the steady state situation for the last three products after 200 seconds. These plots are:
Burification analysis
The next step is to find the coefficients of V and K for the both set of equations. In the subtrate equations we have Vmax=Kcat . E0 where Kcat is the turnover number and E0 is the enzyme's initial concentration.
... to be continued
 "
"


