Team:TUDelft/Temperature results
From 2008.igem.org
Contents |
Results
Assembly of BBa_K115012 and BBa_K115029 - BBa_K115036
The first challenge of this project was to assemble all the devices we wanted to measure. An overview of these devices can be found here. For the actual construction of all devices the 3A assembly strategy was chosen. A complete protocol of this strategy can be found on [http://openwetware.org/wiki/Synthetic_Biology:BioBricks/3A_assembly OpenWetWare]. A schematic representation of this assembly method is depicted in figure 1A and 1B.
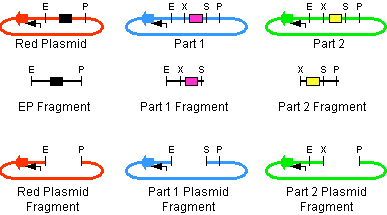
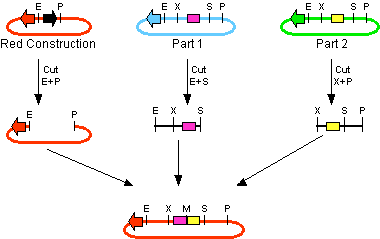
For the succesful use of this assembly, it is essential that the DB3.1 Escherichia coli strain is not used as it tolerates the presence of the CcdB gene. Throughout the project we used commercial Top10 cells of Invitrogen that were made competent chemically. Furthermore, it is important to note that the XbaI and SpeI restriction enzymes generate compatible sticky ends. Assuming that we want to place two BioBrick parts behind each other in one plasmid, but these are present in seperate plasmids before assembly (as is the case in Figure 1A, parts are depicted in purple and yellow in the blue and green plasmid, respectively). 3A assembly can be conducted by taking an empty plasmid that has a different antibiotic resistence as the other two plasmids (red in figure 1A and B, CcdB is present). Three seperate restriction reactions should be started as shown in figure 1A. After cleaning up the restriction reactions they are mixed and ligated together. Parts can be ligated in several ways:
- The CcdB gene can be ligated back in the vector - If this happens, cells will not grow after transfection, as the E. coli strain used should not be CcdB gene tolerant.
- Other parts can be ligated back in the vector - Other plasmids should not have the same antibiotic resistence as the red plasmid, in other words, these are selected for.
- Ligation as depicted in figure 1B - This is the ligation we are looking for and it should yield colonies after transformation.
- Other combinations of backbones and/or parts - It is possible other combinations (e.g. the three backbones together) form a plasmid that yields colonies, these parts will be much larger as the ones formed in option 3. Colony PCR's are performed afterwards to screen for these.
In the end, the result on the gel of the colony PCR product is conclusive in terms of the succes of the 3A assembly. For all our parts at least three of the 3A assemblies (first promoter + ribosome binding site and luciferase + terminators, afterwards the result of these two together) gave our final product. An overview of the result on the gels can be found here. We succeeded in getting colonies that gave the correct band size on the gel for [http://partsregistry.org/cgi/partsdb/pgroup.cgi?pgroup=iGEM2008&group=TUDelft BBa_K115012 and BBa_K115029 - BBa_K115036]. The parts constructed and the temperature at which they are supposed to switch are depicted in table 1 .
| Part Name | Theoretical switching temperature (°C) |
|---|---|
| BBa_K115029 | 42 |
| BBa_K115030 | 37 |
| BBa_K115031 | 37 |
| BBa_K115032 | 42 |
| BBa_K115033 | 37 |
| BBa_K115034 | 27 |
| BBa_K115035 | 32 |
| BBa_K115036 | 37 |
Setting up luciferase measurements
Luminescence of luciferase can be measured in two strains
The first two devices that were succesfully transformed were BBa_K115012 and BBa_K115034. First we wanted an indication whether it was possible to measure luciferase using these constructs, so an experiment was set up with these two strains. The exact protocol used can be found on the 19th of September of the lab notebook. In short, sonication and lysis buffer from the Promega Luciferase kit were used to lyse the cells and luciferase expression was normalized to OD600 of the original sample (before lysis). Furthermore, we cells were grown with and without arabinose induction as an inducible promoter ([http://partsregistry.org/wiki/index.php?title=Part:BBa_R0080 BBa_R0080]) was used. Figure 3 is a graphical representation of the amount of luciferase measured for the two strains the conditions depicted.
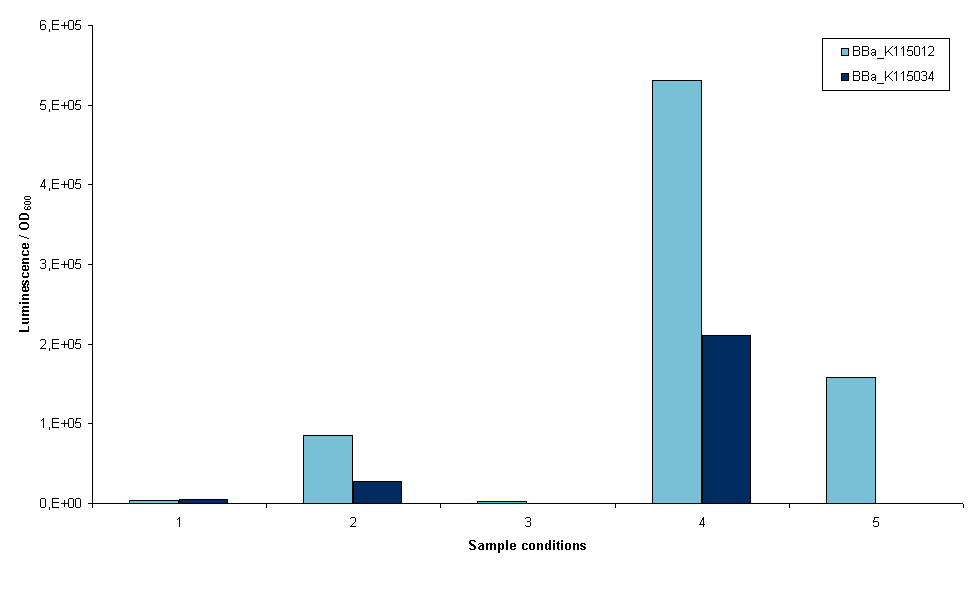
- 1. Induced growth overnight at room temperature, lysis by sonication
- 2. Induced growth overnight at 37ºC, lysis by sonication
- 3. Induced growth two times overnight at room temperature, lysis by sonication
- 4. Induced growth two times overnight at room temperature, lysis by Promega lysis buffer
- 5. Non-induced growth overnight at 37ºC, lysis by sonication (no induction at all, only BBa_K115012)
Several conclusions can be drawn from figure 3, although it has to be noted that this result is only one measurement. Furthermore, room temperature was not controlled. It may have fluctuated between 20 and 27ºC. The first conclusion is that we are able to measure luciferase with these constructs. This means that all parts used work correctly, including our ribosome binding site. The second conclusion is that a differential amount of luminescence is measured between strains BBa_K115012 and BBa_K115034, although in these results we cannot see a difference that is temperature dependent. This can be seen when the bars in conditions 1 and 2 are compared, BBa_K115012 gives a larger difference in luminescence from room temperature to 37ºC than BBa_K115034. The second conclusion is that luminescence measured when lysis is performed with the provided buffer is much higher (compare bars of condition 4 to the rest). The condition measured is not optimal as room temperature is used rather than 37ºC, but even now luminescence is a multitude higher than any of the sonicated samples. The reason for this is not clear: it could be that the lysis buffer lyses cells more efficiently, alternatively it could be that sonication denaturates a large part of the luciferase in the cell. Another conclusion is that the arabinose promoter does not work; a similar amount of luminescence was measured in samples where arabinose was added as compared to non-induced samples (figure 3, compare 5 to 1, 2, and 3).
Total protein content in stead of OD measurements
To compare the amount of luciferase expression measured, the total luminescence should be normalized. In the first experiment we normalized the luminescence to the OD600 in the culture. The OD600 is an indication for the amount of cells present. However, the amount of protein (total protein as well as luciferase) in the sample and thus the amount of luminescence is dependent on the lysis efficiency of the method used. Correcting total luminescence for total amount of protein would circumvent the lysis efficiency. After the first experiment it was decided that total protein content measurements would be conducted in the future. The OD600 will still be measured and lysis efficiency calculated. If a constant lysis efficiency (OD/protein content) is observed, we could still decide to normalize for OD600.
The protocol used for the next experiment measurements can be found here. In figure 4 the results are depicted per construct in luminescence per mg of total protein. A word of caution is in order when interpreting these results, as we found out when performing BC assays (performed according to [http://www.interchim.com/interchim/bio/produits_uptima/tech_sheet/FT-UP40840(BCA).pdf manufacturer's protocol]). The lysis buffer of the Promega luciferase assay kit reacts with copper residues used to determine protein content during the BC assay. Measuring 1x lysis buffer in the BC assay give a higher read-out than any of the samples in the standard calibration curve. The results presented here are obtained by diluting the samples with lysis buffer 1,000 times so their read-out fits within a normal calibration curve, without lysis buffer. Protein content used to normalize luminescence may differ a lot from the actual protein content in the samples, but protein contents could still be proportional.
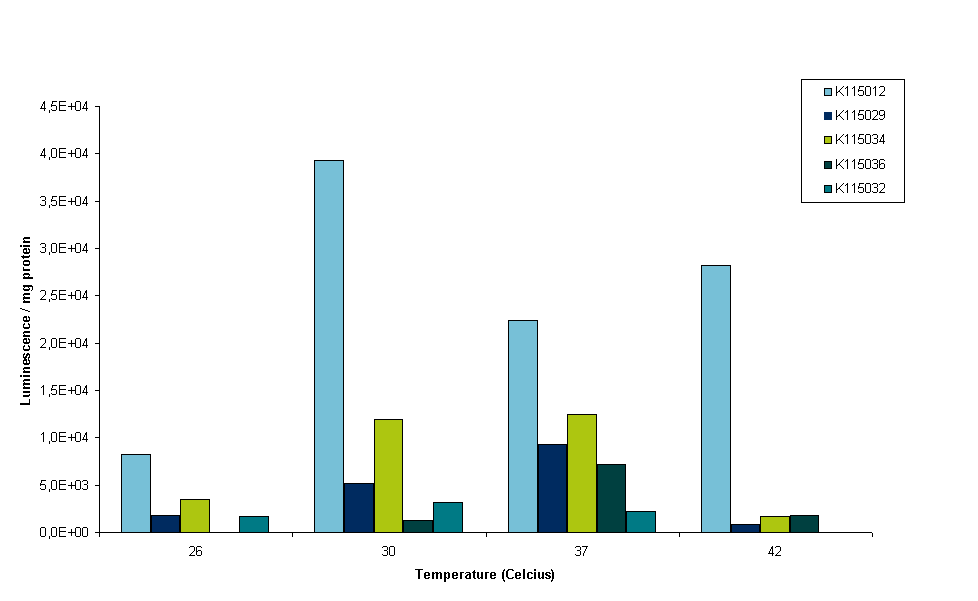
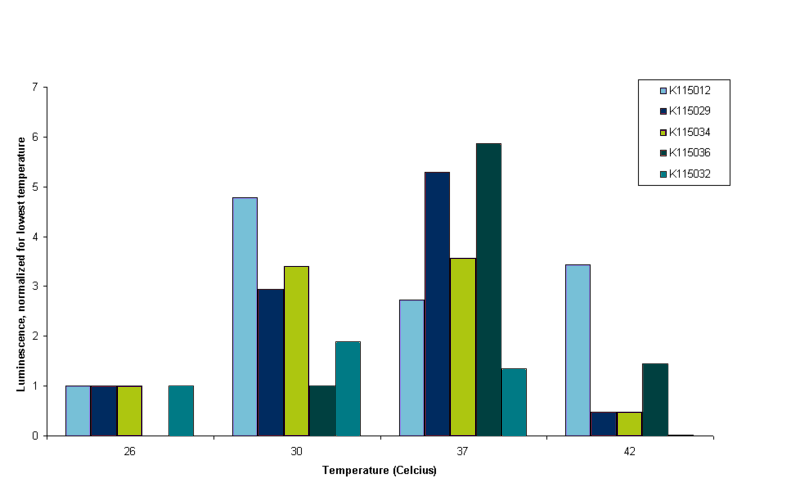
It can be seen in figure 4 that all constructs except BBa_K115012 show very little luminescence at 42ºC. OD readings were very low at this temperature, indicating that E. coli barely survives at that temperature. This is why we conclude that measurements at this temperature are not reliable. Although it is peculiar that BBa_K115012 does have a nice reading at 42ºC, especially since the 37ºC reading is lower than 30 and 42ºC (see figure 4, light purple bars). We think the 37ºC reading of BBa_K115012 was not a good reading, but to establish this we have to measure more samples in the same conditions and perform measurements at least in duplo to take into account biological variance. It was decided however to stop measuring at 42ºC. Further insight into these results is given by figure 5. Figure 5 gives an overview of the results presented in figure 4, but luminescence for each construct is normalized for the luminescence measured at the lowest temperature.
To interpret figure 5 it is important to note that BBa_K115012 is our control, non-temperature sensitive construct. Any 'switching' effect in the other constructs should present itself by an increase of luminescence greater than the standard increase that follows from a higher temperature. So we are looking for an increase in luminescence greater than that of BBa_K115012. From figure 5 it follows that this seems only the case for construct BBa_K115036 going from 30 to 37ºC (see figure 5, compare the bars for BBa_K115012 and BBa_K115036 at 30 and 37ºC). However, lack of a measurement at lower temperature for BBa_K115036, the fact that we performed the measurements only once and shaky protein content measurements make these results unreliable. For now the main conclusions drawn for this experiment is that we devised a protocol that allow us to measure luminescence from the constructs in parallel. The second conclusion is that cell lysis performed with lysis buffer provides us with yet another challenge as lysis buffer reacts with BC assay reagents. We could either try to get rid of the lysis buffer by performing a protein precipitation on the samples before protein content is measured (but not before luminescence is measured, as precipitation denatures proteins), or alternatively we could look for other ways to lyse the cells.
Protein precipitation protocols
Four different protein precipitation protocols were conducted to obtain protein content measurements without the disturbance of lysis buffer. The four protocols can be found here, they are PCA, TCA/acetone, TCA/DOC and methanol/chloroform precipitation.
 "
"
