|
← Yesterday ↓ Calendar ↑Tomorrow →
Extraction of pSB3K3 et E0240 in pSB1A2 plasmid from overnight bacteria culture using the QIAspin Miniprep Kit (QIAGEN) by QIACube.
- Carried out 2 times (2 tubes)
| name
| Biobrick
| plasmid
|
| MP142
| -
| pSB3K3
|
| MP143
| E0240
| pSB1A2
|
Amplification of Genes of interest (OmpR, EnvZ, FlhDC)
We performed PCR on to amplify the sequence in order to have enough amount of DNA to carry out the following of our experiments.
PCR amplification
Protocol
| Number
| Name
| Sequence
| Length
| Comments
|
| O126
| Gene-EnvZ-F
| GTTTCTTCGAATTCGCGGCCGCTTCTAGATGAGGCGATTGCGCTTCTCGCCAC
| 53
|
|
| O127
| Gene-EnvZ-R
| GTTTCTTCCTGCAGCGGCCGCTACTAGTATTATTACCCTTCTTTTGTCGTGCCCTGCGCC
| 60
|
|
| O131
| Gene-FlhC-R
| GTTTCTTCCTGCAGCGGCCGCTACTAGTATTATTAAACAGCCTGTACTCTCTGTTCATCC
| 60
|
|
| O132
| Gene-FlhD-F
| GTTTCTTCGAATTCGCGGCCGCTTCTAGATGCATACCTCCGAGTTGCTGAAAC
| 53
| Don't amplify the natural rbs of FlhD
|
| O138
| Gene-OmpR-F
| GTTTCTTCGAATTCGCGGCCGCTTCTAGATGCAAGAGAACTACAAGATTCTGG
| 53
|
|
| O139
| Gene-OmpR-R
| GTTTCTTCCTGCAGCGGCCGCTACTAGTATTATTAGGCCCTTTTCTTGCGCAGCGCTTCT
| 59
|
|
- Preparation of the templates :
Resuspension of 1 colony in 100µl of water.
For each sample,
1 µl dNTP
10 µl Buffer Phusion 5x
2,5 µl Oligo_F
2,5 µl Oligo_R
1µl template
1 µl Phusion
50 µl qsp H2O (33µl)
| Name
| genes
| Oligo
| templates
|
| PCR_127
| FlhDC
| O131_O132
| MG1655
|
| PCR_128
| OmpR
| O138_O139
| Strain OmpR*
|
| PCR_129
| EnvZ
| O126_O127
| Strain EnvZ*
|
| PCR_Control -
| -
| O126_O127
| Water
|
- Program PCR_Screening : Annealing 55°C - Time élongation 1'30" - Number cycle : 29
PCR verification/Analysis
After the PCR :
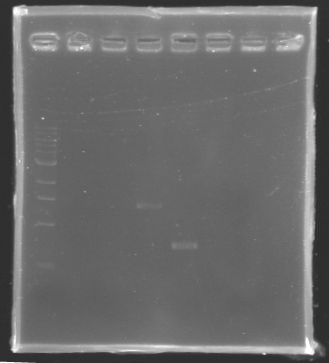
- 3µl have been analysed by electrophoresis
- the other 47µl of PCR products have been purified by the Promega kit.
ladder : 10µl ladder 1 kb
samples : 3µl of PCR products + 2µl of Loading Dye
migration 30min at 100V, on a 1% agarose gel
| Name
| Promotor
| Band
| Expected size
| Measured size
|
| PCR_Control -
| control -
| 2
| 0 pb
| 0 pb
|
| PCR_127
| FlhDC gene
| 3
| 972 pb
| 0 pb
|
| PCR_128
| OmpR gene
| 5
| 762 pb
| 700 pb
|
| PCR_129
| EnvZ gene
| 4
| 1421 pb
| 1400 pb
|
==> Conclusion : we observed the size expected for the PCR products, but not for FlhDC gene.
We hypothesis that its value of amplification for this gene it's low as we can't visualize it. So we try to continue to experiments to know if there is something inside or not this tube.
- Quantification of the PCR products purified
Blank : 2µl of buffer EB + 98µl of water
Samples : 2µl of PCR purified + 98µl of water.
| Name
| Genes
| C° (µg/ml)
| DO 260/280
|
| PCR_127
| FlhDC
| 350
| 1.68
|
| PCR_128
| OmpR
| 150
| 1.97
|
| PCR_129
| EnvZ
| 100
| 1.77
|
| MP 108 cl2 (23 july)
| -vector-
| 150
| 1.84
|
Digestion of PCR products
Protocol :
| Name
| Genes
| Water
| DNA
| Buffer n°2 10X
| BSA 100X
| EcoRI
| PstI
|
| D139
| FlhDC
| 23.7µl
| 1µl
| 3.0µl
| 0.30µl
| 1µl
| 1µl
|
| D140
| OmpR
| 22.7µl
| 2µl
| 3.0µl
| 0.30µl
| 1µl
| 1µl
|
| D141
| EnvZ
| 21.2µl
| 3.5µl
| 3.0µl
| 0.30µl
| 1µl
| 1µl
|
| D142
| -vector-
| 22.7µl
| 2µl
| 3.0µl
| 0.30µl
| 1µl
| 1µl
|
Analysis by electrophoresis
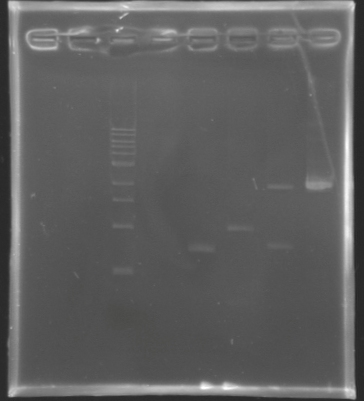 Analysis of PCR product digestion ladder : 10µl ladder 1 kb
samples : 3µl of insert + 2µl of Loading Dye
migration 30min at 100V, on a 1% agarose gel.
| Name
| Promotor
| Band
| Expected size
| Measured size
|
| D139
| FlhDC gene
| 4
| 972 pb
| 0 pb
|
| D140
| OmpR gene
| 5
| 762 pb
| 700 pb
|
| D141
| EnvZ gene
| 6
| 1421 pb
| 1000 pb
|
| D142
| -vector digested-
| 7
| 2057 & 707 pb
| 2000 & 700 pb
|
| D142
| -vector not digested-
| 8
| 2764 pb
| 2100 pb
|
==> Conclusions : We validate the digestion of the vector and the insert. Now we are sure, that we don't detect anything for FlhDC genes.
The return of the promoters
Yesterday, we could not see anything on the electrophoresis after the digestion. Today, we will try the digestion again.
Protocol
| Digestion name
| Template DNA
| Enzymes
| Quantity of DNA used
|
| D132
| PCR 124 - pflgA
| EcoRI-SpeI
| 10 µL
|
| D133
| PCR 125 - pflgB
| EcoRI-SpeI
| 10 µL
|
| D134
| PCR 16 - pflhB
| EcoRI-SpeI
| 10 µL
|
Results
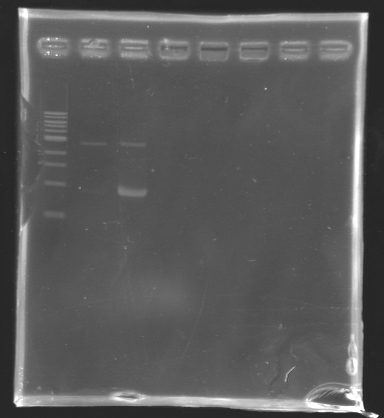
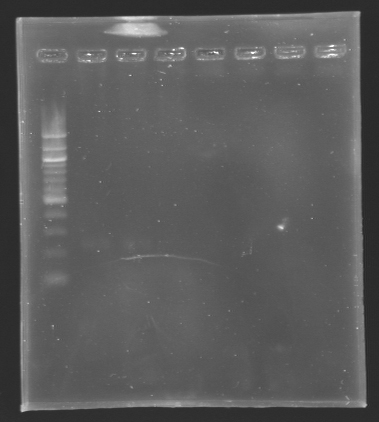 Results of the digestion of the promoters To analyze our digestions, we made an electrophoresis.
- Gel : 1.5% Agar
- Ladder : 100 bp
- 4µL DNA + 2µL Loading Dye
| Name
| Promotor
| Band
| Expected size
| Measured size
|
| D132
| pflgA
| 2
| 250 bp
| 250 bp
|
| D133
| pflgB
| 3
| 250 bp
| 250 bp
|
| D133
| pflhB
| 4
| 249 bp
| 250 bp
|
    Conclusion
    *The bands are not visible on this picture, but with a long exposition time, we managed
     to see the bands at their right place.
    *The concentration of DNA is low!
We will do the ligation tomorrow.
Transformation with promotors of interest
Results
| Name
| Description
| Antibio
| Number of colonies
| Number of red fluorescent colonies
|
| Ligation
|
| L128
| J61002-pFlgA
D136 (FV) - D132 (FI)
| Amp
| ~ 400
| 2
|
| L129
| J61002-pFlgB
D136 (FV) - D133 (FI)
| Amp
| 39
| 5
|
| L130
| J61002-pFlhB
D136 (FV) - D134 (FI)
| Amp
| ~ 1000
| 4 (but 3 are on the edge of the petri dishe)
|
| L131
| J61002-pFlhDC
D136 (FV) - D135 (FI)
| Amp
| 39
| 38
|
| Control
|
| Control 1
| D136
| Amp
| 0
| 0
|
| Positive control
| pUC19
| Amp
| 36
| 0
|
PCR Screening of Ligation Transformants
Use of 8 clones of Ligation transformants for PCR screening
| Ligation
| L128
| L129
| L130
| L131
|
| Name
| pFlgA
| pFlgB
| pFlhB
| pFlhDC
|
| n° clone
| 1
| 2
| 3
| 4
| 5
| 6
| 7
| 8
| 1
| 2
| 3
| 4
| 5
| 6
| 7
| 8
| 1
| 2
| 3
| 4
| 5
| 6
| 7
| 8
| 1
| 2
| 3
| 4
| 5
| 6
| 7
| 8
|
| fluorescence
| red
| red
| no
| no
| no
| no
| no
| no
| red
| red
| red
| red
| red
| no
| no
| no
| red
| no
| no
| no
| no
| no
| no
| no
| red
| red
| red
| red
| red
| red
| red
| no
|
Protocol of screening PCR
25µl of Quick Load 2X
1µl of forward primer 10µM
1µl of reverse primer 10µM
23µl of water
| Ligation
| Name
| primers
|
| L128
| pFlgA
| O100 & O101
|
| L129
| pFlgB
| O102 & O 103
|
| L130
| pFlhB
| O108 & O 109
|
| L131
| pFlhDC
| O111 & O 113
|
- 50µl of PCR Mix by tube/clone
- one toothpick of each clone's colony per tube
- Program : Annealing 55°C - Time élongation 1'30" - Number cycle : 29
- Conditions of electrophoresis
10µl of ladder 100 pb
10µl of screening PCR
migration ~30min at 100V on 1,5% gel
Results of electrophoresis
gel 1 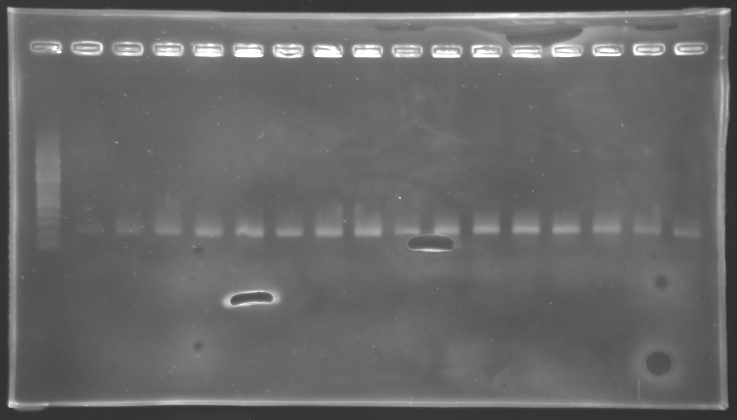 gel 2
gel 2 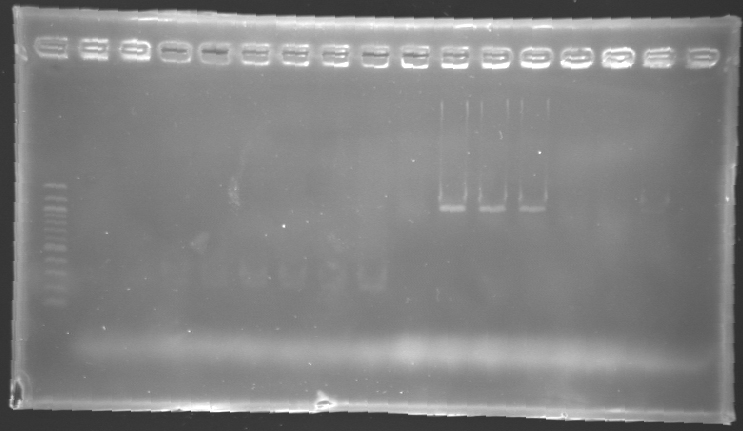
| Name
| Promotor
| Gel
| Band
| Expected size
| Measured size
|
| PCR_124'
| pFlgA
| 1
| 2 to 9
| 261 pb
| 300 pb
|
| PCR_125'
| pFlgB
| 1
| 10 to 17
| 261 pb
| 300 pb
|
| PCR_126'
| pFlhB
| 2
| 2 to 9
| 260 pb
| 300 pb
|
| PCR_127'
| pFlhDC
| 2
| 10 to 17
| 446 pb
| 1,000 pb
|
==> Conclusion:
- PCR of pFlgA, pFlgB and pFlhB have succeed, but we always have a problem with pFlhDC probably because of the primers which are not specific.
Building of the standard measurement plasmid
This morning we MiniPreped E0240 and pSB3K3 which are the two important parts of the standard measurement plasmid.
Before the digestion, we have to determine the DNA concentration of the MiniPreps
Measurement of DNA concentration
| Template
| Concentration
(µg/µL)
| Ratio DO260/DO280
|
MP 142
pSB3K3
| 0.04
| 1.76
|
MP 143
E0240
| 0.16
| 1.66
|
Digestion
Protocol
| Digestion name
| Template DNA
| Enzymes
| Volume of DNA
|
| D 137
| MP 142 - pSB3K3
| EcoRI-SpeI
| 25 µL
|
| D 138
| MP 143 - E0240
| EcoRI-SpeI
| 6.25 µL
|
- X µL of Template DNA
- Buffer (n°2) 10X : 3µL
- BSA 100X : 0.3µL
- Pure water qsp 30 µL
- 1 µL of each enzyme
- Incubate during about 3h at 37°C, then 20 minutes at 65°C (to inactivate the enzymes).
Results of the digestion
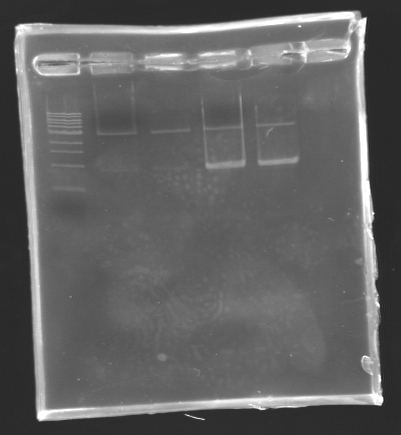
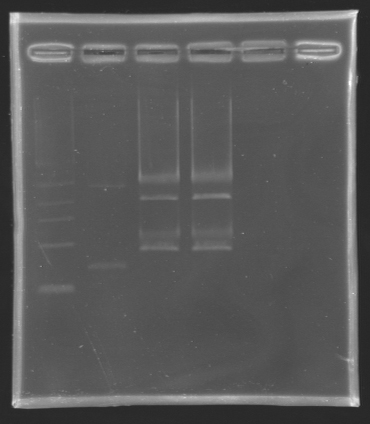 Result of the digestion to build the measurement plasmid Electrophoresis settings
- Gel : 1 % agar
- 4µL template DNA for D137
- All the digestion product for D138 because we have to separate two products, the backbone measures 2056 bp and the insert we want to extract is 899 bp long.
- 10µL QuickLoad DNA ladder 1 kb
| Name
| Band
| Expected size
| Measured size
|
| D 137
| 2
| 2727 bp
| 3000 bp
|
| D 138
| 3&4
| 899 bp
| ~1000 bp
|
Gel extraction and DNA purification
To extract the biobrick E0240 from the gel, we used the standard protocol number 8.
To purify the DNA we used the standard protocol number 10
The ligation will be done tomorrow.
Building an other measurement plasmid
PCR to create the special E0240
Protocol
PCR Mix for cloning with Taq polymerase
- 25µL Quick-load Mix
- 1µL Oligo F (10µM)
- 1µL Oligo R (10µM)
- 1µL Template DNA (MP 143)
- 23µL pure water
We try to build a measurement tool with and without included RBS.
PCR Program
    LID 105°C

    1. 95°C   5 min
    2. 95°C   1 min
    3. 60°C   30 sec
    4. 72°C   1 min 30
    5. go to : 2   rep : 29
    6. sound : 1
    7. hold : 10°C
Results
Electrophoresis settings
- Gel : 1 % agar
- 5µL PCR products
- 10µL QuickLoad DNA ladder 1 kb
| Name
| Band
| Expected size
| Measured size
|
| RBS +
| 2
| 900 bp
| ~ 3000 bp
~ 1000 bp (low fluorescence)
|
| RBS -
| 3
| 881 bp
| ~ 3000 bp
~ 1000 bp (strong fluo)
|
| T
| 4
| nothing
| nothing
|
    Conclusion:
    - There is DNA that is around 3,000 bp. Actually, it is the template DNA (MP 143), there were too much DNA.
      We will have to extract on gel the right piece of DNA.
    - RBS - worked better than RBS +.
Gel Extraction and DNA purification
Electrophoresis settings
- Gel : 1 % agar
- All the PCR products (Two bands for each template)
- 10µL QuickLoad DNA ladder 1 kb
Once again we see that the PCR for RBS - worked a lot better than the PCR for RBS +. We will do it again on monday.
To extract RBS - from the gel, we used the standard protocol number 8.
To purify the DNA we used the standard protocol number 10
|
 "
"

